Are the gold bugs back in the market?
Gold has changed course, and now the market is trading higher. John C Burford draws his tramlines to set his targets in the charts.
Get the latest financial news, insights and expert analysis from our award-winning MoneyWeek team, to help you understand what really matters when it comes to your finances.
You are now subscribed
Your newsletter sign-up was successful
Want to add more newsletters?

Twice daily
MoneyWeek
Get the latest financial news, insights and expert analysis from our award-winning MoneyWeek team, to help you understand what really matters when it comes to your finances.

Four times a week
Look After My Bills
Sign up to our free money-saving newsletter, filled with the latest news and expert advice to help you find the best tips and deals for managing your bills. Start saving today!
When I last covered gold on 22 September, I put the case for an imminent upside reversal from the steep downtrend it was enduring. This downtrend was so persistent that virtually all of the bulls had thrown in the towel and the DSI (daily sentiment index) had sunk to a paltry 7% bulls.
That low bullish reading was truly scraping the bottom of the barrel and I knew that these were ideal conditions to set up a severe counter-trend rally of some magnitude.
This was a rally I wished to trade from the long side, having taken profits already on the move down. I foresaw a move of at least $100. Depending on your spread betting platform, this could translate into a profit of $10,000 for a £1 bet. Very juicy!
MoneyWeek
Subscribe to MoneyWeek today and get your first six magazine issues absolutely FREE

Sign up to Money Morning
Don't miss the latest investment and personal finances news, market analysis, plus money-saving tips with our free twice-daily newsletter
Don't miss the latest investment and personal finances news, market analysis, plus money-saving tips with our free twice-daily newsletter
So, today I want to show you what happened with this trade.
Timing is everything
These were my short-term tramlines I was working then:
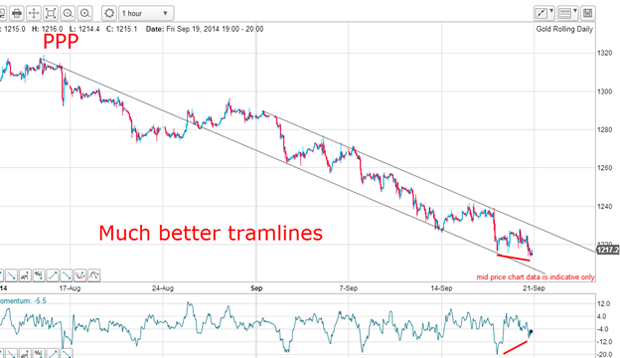
The looming large positive-momentum divergence certainly drew my attention! But was this the low?
It certainly was at least, for a while. The market then took off and moved above my upper tramline which triggered a long trade. So far, so good.
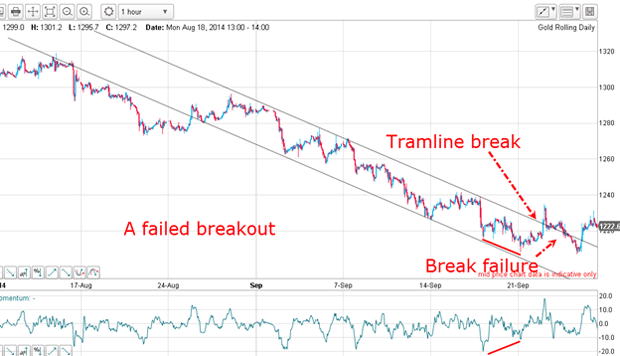
The upside break was sharp and now, the test was to see if any pull-back to the tramline would hold. This is the litmus test for any breakout and proves whether it is a genuine break or not.
In fact, the market did pull back to the line in a kiss but did not follow through in a scalded-cat bounce as I expected.
The market then dribbled down back into the trading channel and my trade was taken out on my stop, which was placed just under the tramline.
It was back to the drawing board for me.
But the action showed me that although my timing was out, I was getting closer to the turn.
Why it's OK to have a losing trade
The initial losing trade I just described is typical of my trading style. In gold, I often have to take one or even two abortive trades before getting on board a good new trend. The key though, is that I ensure the loss is as small as possible on those losing trades.
If I can look forward to at least a $50 gain say, I can afford to lose $10-$20 in the process.
I decided to step back and watch the market develop over the next few days and when it made a new low on Monday, I could place my Elliott wave (EW) labels:
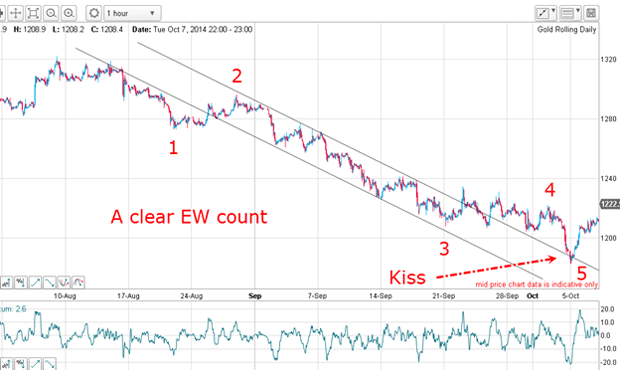
I had my five complete waves! In addition, wave 5 planted a nice kiss on my upper tramline and staged the scalded-cat bounce that I was expecting.
The deeply oversold momentum reading at this fifth wave low told me that this was the wash-out selling exhaustion I had anticipated. If so, the big rally can get started from here.
Naturally, the ideal long entry was near the wave 5 low. But you needed nerves of steel to place that trade after all, the market was in a steep downtrend. Are we not taught to never trade against the trend? Like all rules of trading, if you know what you are doing, you can break them safely.
And nerves of steel is what a good trader very often needs. As it happens, some of my best low-risk trades are taken against the trend. But you need a solid method of analysis to winkle them out, such as my tramline system.
Have the gold bugs come out of hiding?
Time now to search for a new tramline set:
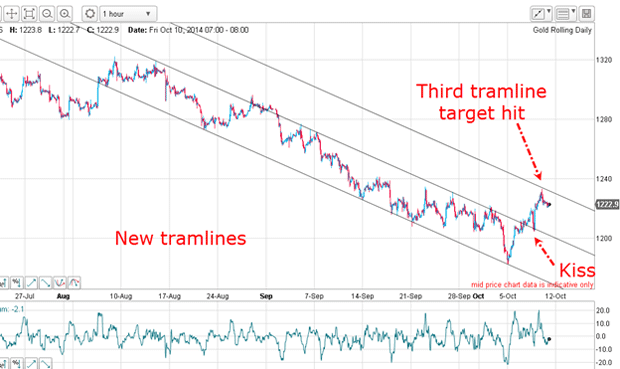
And I have an excellent pair here with the lower tramline having multiple accurate touch points (a near-rarity on the spiky gold charts). Then, the market broke up through the centre tramline, came back to plant a textbook kiss and roared back up in a solid scalded-cat bounce.
That sealed it my budding large counter-trend rally was on. And the short squeeze I had forecast was now in progress.
Note the market made it to my third tramline which I had drawn when the centre tramline had been broken. That was an excellent place to take at least partial profits. The gain was a very decent $45 off the low, which is about half-way to my expected target.
Looking at the bigger picture on the daily:
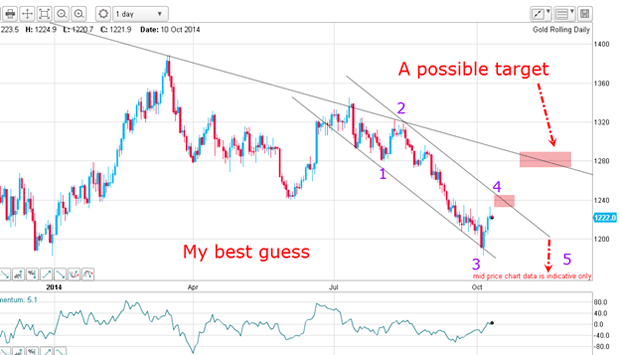
I now have my third wave low and the market is now in the fourth wave. My first realistic target is on the upper tramline around $1,240.
But if gold catches a bid, the upper target is possible.
Are the gold bugs coming out of hiding at last?
Get the latest financial news, insights and expert analysis from our award-winning MoneyWeek team, to help you understand what really matters when it comes to your finances.
John is is a British-born lapsed PhD physicist, who previously worked for Nasa on the Mars exploration team. He is a former commodity trading advisor with the US Commodities Futures Trading Commission, and worked in a boutique futures house in California in the 1980s.
He was a partner in one of the first futures newsletter advisory services, based in Washington DC, specialising in pork bellies and currencies. John is primarily a chart-reading trader, having cut his trading teeth in the days before PCs.
As well as his work in the financial world, he has launched, run and sold several 'real' businesses producing 'real' products.
-
 Average UK house price reaches £300,000 for first time, Halifax says
While the average house price has topped £300k, regional disparities still remain, Halifax finds.
-
 Barings Emerging Europe trust bounces back from Russia woes
Barings Emerging Europe trust has added the Middle East and Africa to its mandate, delivering a strong recovery, says Max King