Is the gold price ready to rally now?
Gold is a slippery customer, says John C Burford. Just when you believe you have it figured out, it springs a surprise.
Get the latest financial news, insights and expert analysis from our award-winning MoneyWeek team, to help you understand what really matters when it comes to your finances.
You are now subscribed
Your newsletter sign-up was successful
Want to add more newsletters?

Twice daily
MoneyWeek
Get the latest financial news, insights and expert analysis from our award-winning MoneyWeek team, to help you understand what really matters when it comes to your finances.

Four times a week
Look After My Bills
Sign up to our free money-saving newsletter, filled with the latest news and expert advice to help you find the best tips and deals for managing your bills. Start saving today!
In my post of 15 September, I made a case for gold to begin embarking on a good rally. The market has been falling since the E wave high of July a decline of some $130 to this morning's low.
So, let's review the position. This was the hourly chart back then:
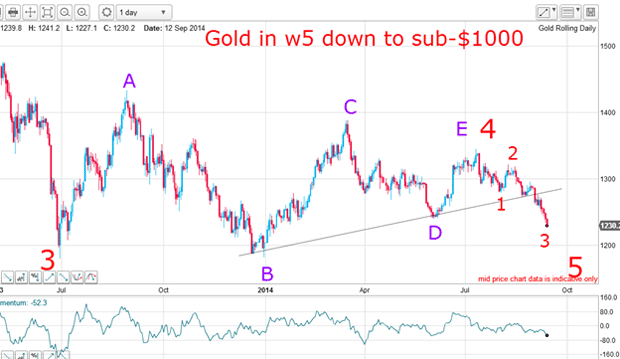
It certainly appears very bearish with major support levels having been violated. On the chart I noted my long-standing target of under $1,000. But using simple wave period equality, I estimated that this low would occur sometime in mid-2015.
MoneyWeek
Subscribe to MoneyWeek today and get your first six magazine issues absolutely FREE

Sign up to Money Morning
Don't miss the latest investment and personal finances news, market analysis, plus money-saving tips with our free twice-daily newsletter
Don't miss the latest investment and personal finances news, market analysis, plus money-saving tips with our free twice-daily newsletter
Of course, in the meantime, there will be many twists and turns this is gold, after all. Gold is a slippery customer just when you believe you have it figured out, it springs a surprise, at least in the short term.
One thing is for sure the market will not head straight down with no intervening rallies. But will the rally start this week?
When to jump on board a trade
The market is currently in a third wave down, but at some point that wave will terminate and start a fourth wave rally. The task of a swing trader is to detect precisely when that event occurs and jump on board if the prospects for a decent move are high.
Recall, bullish sentiment is in the basement, so even a minor buying spree from genuine demand and/or short covering should provide some fireworks to the upside.
In fact, prospects for a massive short squeeze are exceptionally high given the recent 7% DSI (daily sentiment index) bullish reading a near record low.
In my 15 September post, I drew a nice tramline pair:
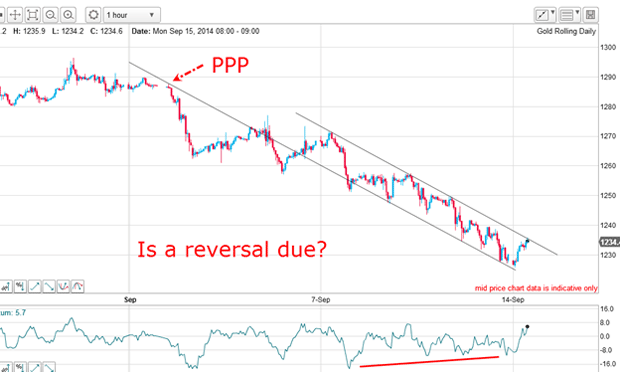
The market had rallied to the upper tramline and there was a large positive-momentum divergence. The scene was set for a possible reversal there. But last week, there was more selling at the line and the market resumed its downtrend. The upper tramline was acting as resistance its traditional role and it had not been broken, so no trade signal was given.
The search for tramlines never ends
But I was not entirely happy with the above tramlines the lower line in particular had too many pigtails and overshoots to give me confidence in the pair. So I searched for a better fit and this is what I came up with:
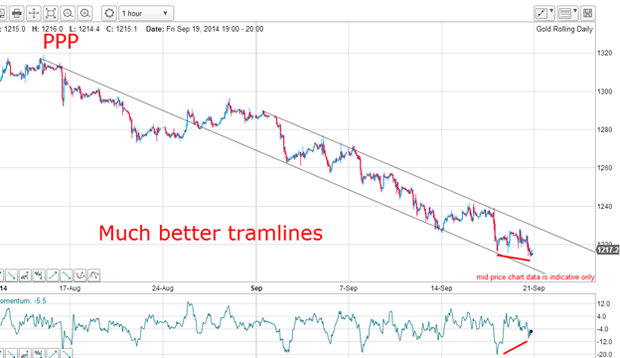
My lower tramline now has a superb PPP (prior pivot point) and much more accurate touch points. My upper line also has multiple accurate touch points. That is much better. If the market declines further towards the lower line, a trade may be available provided the positive-momentum divergence holds.
But that is not the only valid tramline pair I can draw! Scrolling back in time to July, I have a valid longer-term pair:
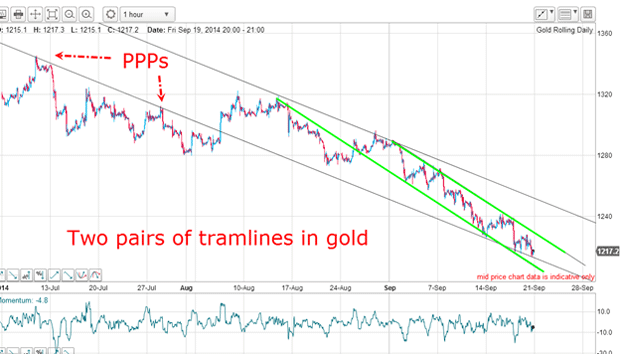
The lower line has three magnificent PPPs and the upper line has several accurate touch points. This is a good pair.
This brings up an important point when searching for tramlines on your charts. Don't be satisfied with one set check to see if there any longer-term tramlines working, as here.
Is there a trade here?
The market is testing the lower line of the longer-term pair and is heading towards the lower green tramline. Here is a close-up:
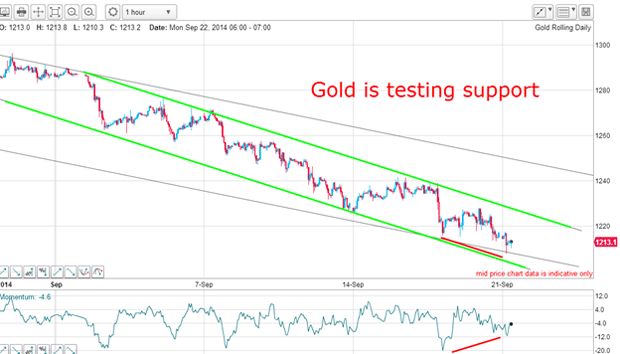
This morning, gold touched the lower long-term tramline in a huge positive-momentum divergence. Remember, a positive-momentum divergence indicates that selling power is weakening. In order to get me interested in a trade, I must see a momentum divergence and the wider the better.
The trend remains down, which means that I must perceive a very good signal in order to trade. To find that, I go to the 15-minute chart:
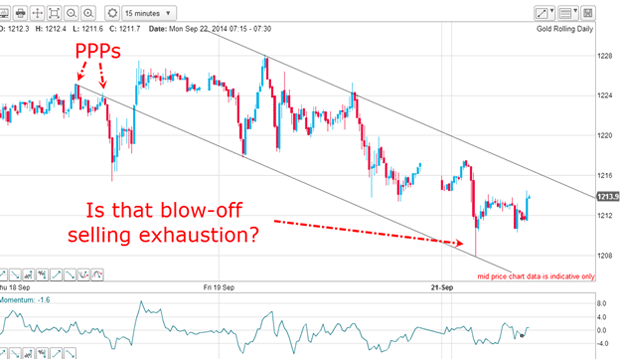
I have a superb lower tramline with excellent PPPs. Early this morning, the market made a spike low to this line and is currently bouncing up towards the upper line. Admittedly, this line is speculative at this stage.
My question to you is this: is there a trade here?
Get the latest financial news, insights and expert analysis from our award-winning MoneyWeek team, to help you understand what really matters when it comes to your finances.
John is is a British-born lapsed PhD physicist, who previously worked for Nasa on the Mars exploration team. He is a former commodity trading advisor with the US Commodities Futures Trading Commission, and worked in a boutique futures house in California in the 1980s.
He was a partner in one of the first futures newsletter advisory services, based in Washington DC, specialising in pork bellies and currencies. John is primarily a chart-reading trader, having cut his trading teeth in the days before PCs.
As well as his work in the financial world, he has launched, run and sold several 'real' businesses producing 'real' products.
-
 MoneyWeek Talks: The funds to choose in 2026
Podcast Fidelity's Tom Stevenson reveals his top three funds for 2026 for your ISA or self-invested personal pension
-
 Three companies with deep economic moats to buy now
Opinion An economic moat can underpin a company's future returns. Here, Imran Sattar, portfolio manager at Edinburgh Investment Trust, selects three stocks to buy now