Gold is getting ready for a big rally
Sentiment has become ultra-bearish in gold, says John C Burford. Get ready for a major trend reversal.
Get the latest financial news, insights and expert analysis from our award-winning MoneyWeek team, to help you understand what really matters when it comes to your finances.
You are now subscribed
Your newsletter sign-up was successful
Want to add more newsletters?

Twice daily
MoneyWeek
Get the latest financial news, insights and expert analysis from our award-winning MoneyWeek team, to help you understand what really matters when it comes to your finances.

Four times a week
Look After My Bills
Sign up to our free money-saving newsletter, filled with the latest news and expert advice to help you find the best tips and deals for managing your bills. Start saving today!
In a recent post, I noted that the skills required to be a good market analyst are very different from those required of a trader.
Today, I want to explore this idea with the use of the gold market, which is conforming to my forecast contained in my postof 3 September.
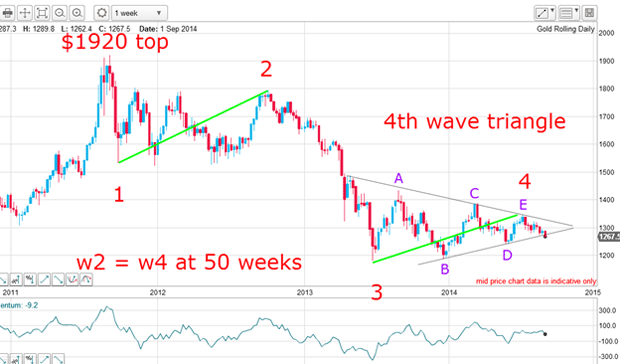
In that post, I forecast that the most likely path of gold was down. It was trading at the $1,270 level then and now it trades at $1,230. I based my analysis largely on my Elliott wave(EW) analysis of the fourth wave triangle (or wedge). Also, the line connecting the lows of waves B and D had just been broken:
MoneyWeek
Subscribe to MoneyWeek today and get your first six magazine issues absolutely FREE

Sign up to Money Morning
Don't miss the latest investment and personal finances news, market analysis, plus money-saving tips with our free twice-daily newsletter
Don't miss the latest investment and personal finances news, market analysis, plus money-saving tips with our free twice-daily newsletter

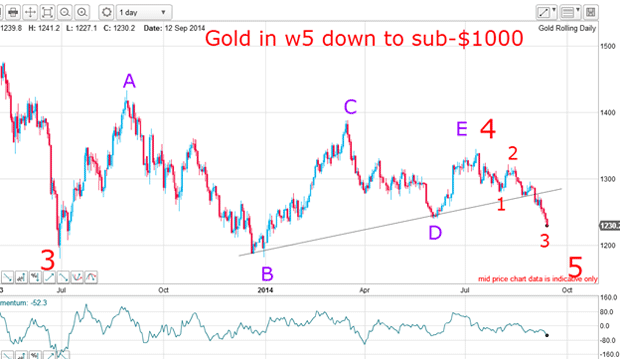
And this is the picture today on the daily chart:

As I forecast on 3 September, my first major target the wave D low was hit last week and the market now trades under that level in confirmation of the downtrend in wave 5.
This is what I wrote then: "One final thought - if the Ukraine conflict (and attendant economic sanctions) cannot light a fuse under gold, then the path of least resistance appears well and truly down."
So my forecast was highly accurate, despite the continued global conflicts, which by conventional thinking should support gold.
But how to trade it?
Maximise your chance of a profitable trade
That is where a different skill set is needed.
Because I am always looking for a low-risk entry for my swing trades, I just cannot jump in with both feet when I feel like it as an analyst can (because they have no money at stake!). I must plan my tactics carefully so as to maximise my chances for a profitable trade.
Before I do that, let's recap what skills I needed to analyse the market back on 3 September.
I needed a firm grasp of Elliott wave theory when the market makes a fourth wave triangle. Of course, I needed to be able to label the large waves correctly in the first place and to recognise early on that the market was actually forming a fourth wave triangle.
Then, I needed to recognise the March rally as a possible C wave, which would top out below the A wave. Any move above it would negate my EW analysis.
Finally, with waves A, B, C and D in place in June, I could project the E wave the final wave of the sequence to top under the C wave.
In August, with the market moving lower, I could then anticipate waves 1 and 2 of the fifth wave down. And with the break of wave 1, I can say the market is in a third wave down. That analysis gave me my roadmap.
In terms of trading, I needed to find a short entry based on my tramline system.
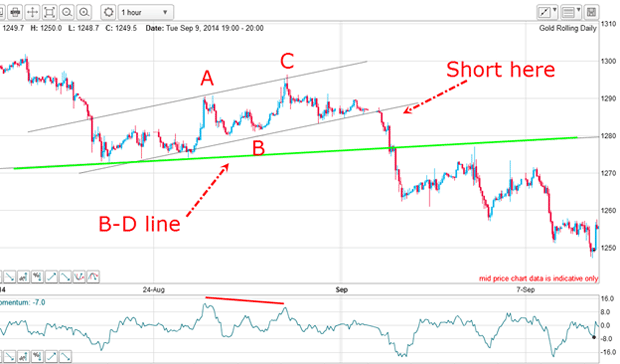
Here is a case in point from the last week in August:

I have a good short-term tramline pair drawn on the action up from the B-D line bounce. This bounce has an A-B-C form and there is a negative-momentum divergence at the C wave high.
The correct trade was to short on a sell-stop on the lower tramline break with a protective stop less than $10 away, giving me my required high-probability/low-risk entry. That entry was in the $1,285 area, giving a profit of over $50 to date. That equates to a $5,000 gain on a £1 spread bet. Nice and all gained from the correct application of my trade entry system.
Of course, although we have a good trade working, we must be on the alert for a possible sharp reversal and clues for this can come from a study of the market sentiment.
Don't be blindsided by a change in market sentiment
On the back of the recent decline, sentiment has become ultra-bearish with the Daily Sentiment Index (DSI) having fallen to only 9% bulls (silver bulls number only 7%).
That extreme bearishness alone puts me on high alert for an imminent reversal!
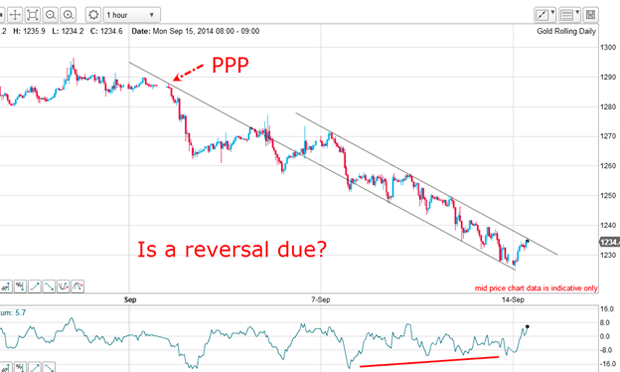
It is time to look at the short-term picture:

I have a good tramline pair working and the market has this morning rallied up to the upper line in another test. Note the very large positive-momentum divergence at Friday's low a sign that selling is drying up.
That is no surprise, because with only 9% bulls, there cannot be many bears left to add to the selling pressure. And this highlights a great way to read sentiment data. When sentiment is lop-sided as here, think of the army of bears as being nearly out of ammunition, while the bulls have yet to strike as they see low prices as a bargain.
With the tramline break, what are my targets? A normal retrace of a wave is 50%/62% and that sets my short-term targets at the $1,260 and $1,270 levels.
Of course, if the market rallies to kiss the B-D line and we know that kisses are common that target is in the $1,280 - $1,290 area.
Naturally, a tramline break would set off my buy-stop on my short trade and I would bag a great profit and go long.
Meanwhile, I will let the market decide, as always.
Get the latest financial news, insights and expert analysis from our award-winning MoneyWeek team, to help you understand what really matters when it comes to your finances.
John is is a British-born lapsed PhD physicist, who previously worked for Nasa on the Mars exploration team. He is a former commodity trading advisor with the US Commodities Futures Trading Commission, and worked in a boutique futures house in California in the 1980s.
He was a partner in one of the first futures newsletter advisory services, based in Washington DC, specialising in pork bellies and currencies. John is primarily a chart-reading trader, having cut his trading teeth in the days before PCs.
As well as his work in the financial world, he has launched, run and sold several 'real' businesses producing 'real' products.
-
 Average UK house price reaches £300,000 for first time, Halifax says
While the average house price has topped £300k, regional disparities still remain, Halifax finds.
-
 Barings Emerging Europe trust bounces back from Russia woes
Barings Emerging Europe trust has added the Middle East and Africa to its mandate, delivering a strong recovery, says Max King