Why is the gold price under pressure?
Gold has witnessed a big recent sell-off. John C Burford looks at the charts to see what's made the market so bearish.
Get the latest financial news, insights and expert analysis from our award-winning MoneyWeek team, to help you understand what really matters when it comes to your finances.
You are now subscribed
Your newsletter sign-up was successful
Want to add more newsletters?

Twice daily
MoneyWeek
Get the latest financial news, insights and expert analysis from our award-winning MoneyWeek team, to help you understand what really matters when it comes to your finances.

Four times a week
Look After My Bills
Sign up to our free money-saving newsletter, filled with the latest news and expert advice to help you find the best tips and deals for managing your bills. Start saving today!
With traders back at their desks after the US Labor Day holiday, the markets have sprung to life in no uncertain manner. Yesterday, we saw big falls in gold, crude oil and Treasuries in particular.
On Thursday, the European Central Bank (ECB) is expected to announce a plan to stimulate the eurozone economy and traders are positioning for what they believe will emerge.
Today, I want to cover gold, because the breakdown yesterday has put the market in a very bearish position.
MoneyWeek
Subscribe to MoneyWeek today and get your first six magazine issues absolutely FREE

Sign up to Money Morning
Don't miss the latest investment and personal finances news, market analysis, plus money-saving tips with our free twice-daily newsletter
Don't miss the latest investment and personal finances news, market analysis, plus money-saving tips with our free twice-daily newsletter
On Friday, the market was staging a rally, but I noted it had an A-B-C form with a negative-momentum divergence and it was these factors that put the rally in doubt in my mind.
I wrote: "The big question is will the rally extend? The move off the lows has an A-B-C feel to it and there is a small negative-momentum divergence at yesterday's high.
"If it can overcome these limitations, the next target becomes the 62% retrace in the $1,300 area. Otherwise, a decline to try a kiss on the third tramline is possibly on the cards".
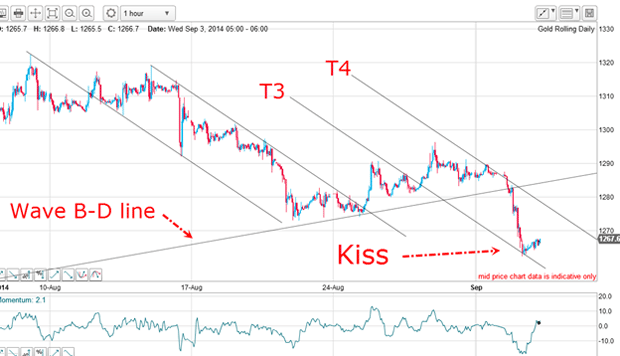
How does yesterday's $20 decline fit into this picture? Here is the updated hourly chart:

The market declined to T3 and has made a solid accurate kiss on the line as I suspected. That is very pretty. Remember, I drew this tramline well before the market made the kiss.
But what is just as pretty is to see what happens when I draw in my fourth tramline, T4. Yesterday morning the market touched it and then collapsed to make the T3 kiss. Now, the market is trading in the T3/T4 trading channel and will stay there until it breaks out.
The power of tramlines
Then, when a break of T3 occurred, I could put in T4 as a target (which was also hit).
Isn't that simple? My tramline method requires no complex maths and no arcane indicators. All you have to do is draw some parallel equidistant straight lines a purely visual skill.
There were several opportunities to enter short trades (and exit longs) using these tramlines for guides.
So now the market is tracking the third tramline, but has broken the very important $1,275 level, which lay on the wave B-D support line. There was a mountain of sell-stops under this line which contributed to the sharp decline.
And who was unloading their long positions via sell-stops? Here is the latest commitment of traders (COT) data:
| (Contracts of 100 troy ounces) | Row 0 - Cell 1 | Row 0 - Cell 2 | Row 0 - Cell 3 | Open interest: 363,608 | ||||
| Commitments | ||||||||
| 172,022 | 58,853 | 23,465 | 127,433 | 250,981 | 322,920 | 333,299 | 40,688 | 30,309 |
| Changes from 08/19/14 (Change in open interest: -2,793) | ||||||||
| -11,824 | 12,983 | 3,065 | 5,056 | -19,058 | -3,703 | -3,010 | 910 | 217 |
| Percent of open in terest for each category of traders | ||||||||
| 47.3 | 16.2 | 6.5 | 35.0 | 69.0 | 88.8 | 91.7 | 11.2 | 8.3 |
| Number of traders in each category (Total traders: 263) | ||||||||
| 124 | 70 | 68 | 54 | 48 | 205 | 162 | Row 8 - Cell 7 | Row 8 - Cell 8 |
Already, on 26 August, the hedgies were reducing their longs and increasing their shorts as they sniffed a downtrend was in the air. But they remain overwhelmingly long. As I mentioned last time, this lop-sided long position will inhibit any big rally at least in the short term.
The long-term view on gold

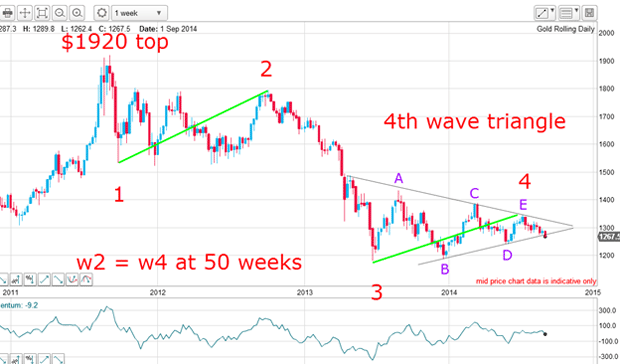
I can now complete my fourth wave triangle, which shows a textbook five-wave pattern marked A-B-C-D-E.
But there is something curious about this chart. If wave 4 has ended at the July high, as seems very likely, the time taken from the wave 3 low to the wave 4 high is 50 weeks the very same time taken by wave 2 to complete from the wave 1 low! This is suspiciously close to a calendar year and could be the result of a symmetric cycle effect.
This raises the intriguing idea that the next major low could be ten months away in April/May 2015 the time between the wave 2 high and wave 3 low.
If the market is in a final fifth wave down, what is a possible target?
One common relationship between waves in an impulsive sequence is the equality of waves 1 and 5.
Measuring the height of wave 1 from the top gives a distance of $390. Taking the wave 4 high at $1,345, I come up with a wave 5 target of $955.
Of course, this fifth wave can develop in many ways, but it is very unusual to see a short fifth wave and to at least qualify as a fifth, it must drop below the wave 3 low at $1,180.
But the shorter-term target is the wave D low at $1,240 only less than $30 away.
One final thought - if the Ukraine conflict (and attendant economic sanctions) cannot light a fuse under gold, then the path of least resistance appears well and truly down.
Get the latest financial news, insights and expert analysis from our award-winning MoneyWeek team, to help you understand what really matters when it comes to your finances.
John is is a British-born lapsed PhD physicist, who previously worked for Nasa on the Mars exploration team. He is a former commodity trading advisor with the US Commodities Futures Trading Commission, and worked in a boutique futures house in California in the 1980s.
He was a partner in one of the first futures newsletter advisory services, based in Washington DC, specialising in pork bellies and currencies. John is primarily a chart-reading trader, having cut his trading teeth in the days before PCs.
As well as his work in the financial world, he has launched, run and sold several 'real' businesses producing 'real' products.
-
 How should a good Catholic invest? Like the Vatican’s new stock index, it seems
The Vatican Bank has launched its first-ever stock index, championing companies that align with “Catholic principles”. But how well would it perform?
-
 The most single-friendly areas to buy a property
There can be a single premium when it comes to getting on the property ladder but Zoopla has identified parts of the UK that remain affordable if you aren’t coupled-up