Is the rally in the gold market over?
Gold has been in a volatile mood of late. John C Burford applies his trading analysis to the charts to find out where the market is heading to next.
Get the latest financial news, insights and expert analysis from our award-winning MoneyWeek team, to help you understand what really matters when it comes to your finances.
You are now subscribed
Your newsletter sign-up was successful
Want to add more newsletters?

Twice daily
MoneyWeek
Get the latest financial news, insights and expert analysis from our award-winning MoneyWeek team, to help you understand what really matters when it comes to your finances.

Four times a week
Look After My Bills
Sign up to our free money-saving newsletter, filled with the latest news and expert advice to help you find the best tips and deals for managing your bills. Start saving today!
In my last post on gold on 5 August, I asked whether gold is heading for $1,400.
After all, there was a vigorous relief rally in progress off the late-June low of $1,180 and sentiment had turned very bearish. Earlier this summer, I saw a reading of only 3% bulls. That's an amazing change from the heady days of the bull market, when the reading was 3% bears.
Just as 3% bears produced a top to the bull market, so 3% bulls did the reverse hence the relief rally.
MoneyWeek
Subscribe to MoneyWeek today and get your first six magazine issues absolutely FREE

Sign up to Money Morning
Don't miss the latest investment and personal finances news, market analysis, plus money-saving tips with our free twice-daily newsletter
Don't miss the latest investment and personal finances news, market analysis, plus money-saving tips with our free twice-daily newsletter
This will go into the history books as a stunning example of how traders herd together when they see a simple story. It is a natural human trait. And canny traders can use this knowledge to extract profits from the herd, of course.
But whether you can do this in practice is a function of your own psychology. This is a critical component of your trading success.
Many traders come from the world of stock trading/investing, where being long is the only strategy they know. So buying the dips comes as second nature and works well in a bull market.
But when they come to trading the financial markets such as gold or FX or the Dow, they find it mentally difficult to adjust to shorting in a rising market. They habitually view a rising market as a reason to jump on board, as this has generally worked with stocks. Old habits die hard!
But that is what is required in swing trading. It seems you know what to do, but something prevents you from doing it.
That is one reason why the skill required for market analysis is totally different from the skill needed for trading those markets. Most analysts are not good traders!
Fresh tramlines in the gold market
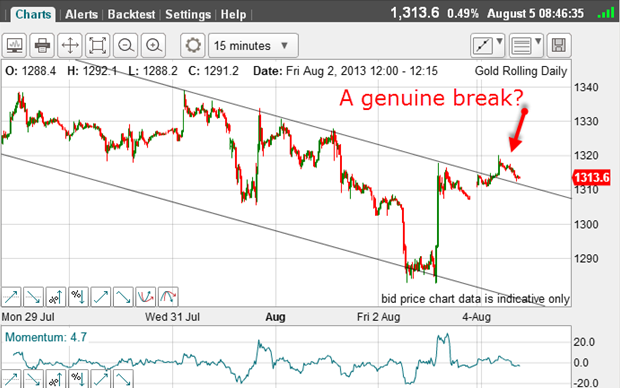
This was the picture then, which is very short-term and normally much too short to use for swing trading. But it is an example of how a head fake can lead you astray.
But in general, I advise starting with the daily chart, then moving to the hourly, where you can draw your working tramlines.
Let's look at that period on the hourly:
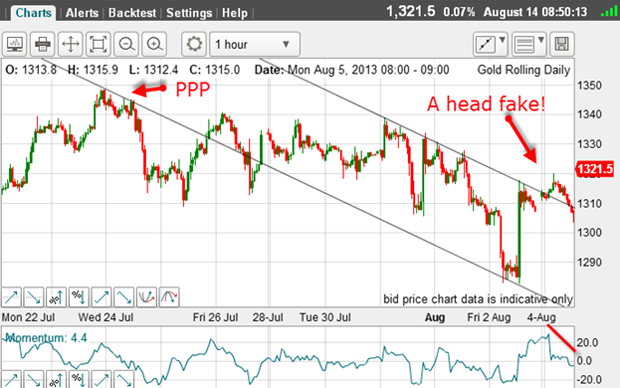
My lower tramline is not ideal as it has only one touch point, but does have a good prior pivot point (PPP). But the trading below this line in late July is problematic.
My upper line is fine as it has many touch points, but is very closely spaced over only four days. This is not enough time to tell whether this line is genuine.
As the market moved above the line, it was making a clear A-B-C on a negative-momentum divergence a stark warning sign. And the market did indeed move back into the trading channel following that signal. It was a head fake.
But let's take a step back and see if there was a more reliable tramline pair we could apply to the relief rally which would give us a more reliable reading:
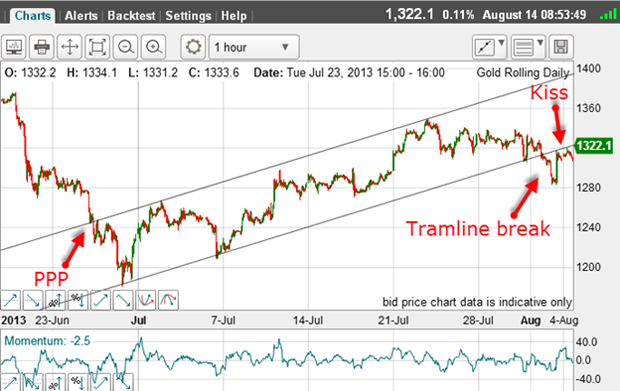
Here are my tramlines drawn off the late June points, with the upper line having a PPP and three touch points, making it a solid line of resistance.
My lower line starts at the $1,180 low and takes in the major lows of 5 July and 31 July 26 days apart. Note that this latter touch point lies at a great distance from the earlier ones, thus giving me much more confidence in my lower tramline placement.
Now the action described in my first chart takes on a very different hue in fact, the rally following the tramline break is reversed in a classic tramline kiss!
In fact, there are two kisses and a great place to look for a short trade.
If I had focused just on the above 15-minute chart alone, I may have been tempted to take a long trade on the upper tramline break, which would have been a loser.
The moral: keep referring to the longer-term picture before lining up your trades.
So where are we today in gold?
And on Monday, the market rallied to $1,340 in yet another tramline kiss. Evidently, this lower tramline is very attractive!
If we take a further step back to examine the daily chart, I have a very acceptable set off four tramlines with this week's rally to $1,240 bouncing off the second tramline.
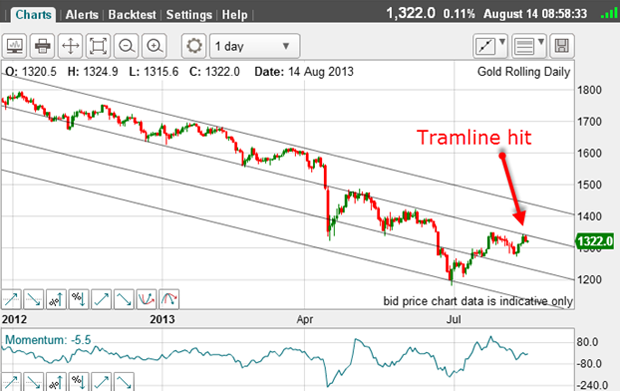
This means the main downtrend is intact and one should always be looking to trade in this direction. Never forget: the trend is your friend.
Now, I can combine the daily with the hourly and find:
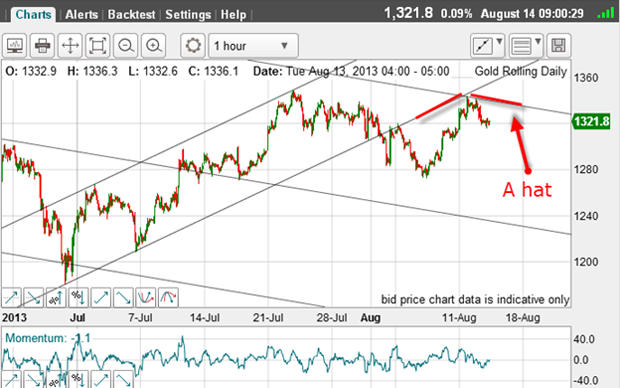
I have a hat formation! This is where tramlines on different time frames meet and represents extra solid resistance. I have showed several examples of hats in recent posts.
That is a great place to look for a short trade and trade with the main trend our goal.
If the trade continues to work in our favour, what is the first target?
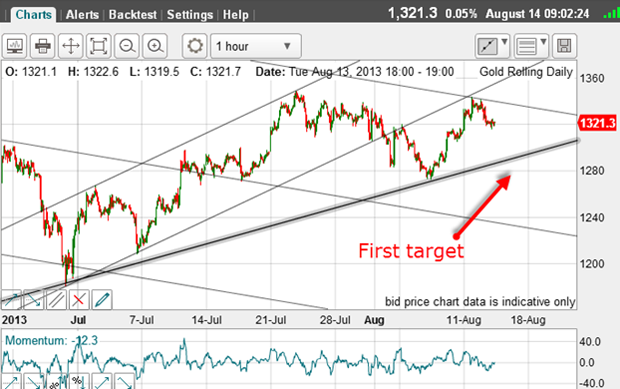
Here is the new trendline and my target then lies on this line in the $1,280 -$1,300 area.
Remember, the best trades will be with the main trend and against the shorter-term trend.
Get the latest financial news, insights and expert analysis from our award-winning MoneyWeek team, to help you understand what really matters when it comes to your finances.
John is is a British-born lapsed PhD physicist, who previously worked for Nasa on the Mars exploration team. He is a former commodity trading advisor with the US Commodities Futures Trading Commission, and worked in a boutique futures house in California in the 1980s.
He was a partner in one of the first futures newsletter advisory services, based in Washington DC, specialising in pork bellies and currencies. John is primarily a chart-reading trader, having cut his trading teeth in the days before PCs.
As well as his work in the financial world, he has launched, run and sold several 'real' businesses producing 'real' products.
-
 MoneyWeek Talks: The funds to choose in 2026
Podcast Fidelity's Tom Stevenson reveals his top three funds for 2026 for your ISA or self-invested personal pension
-
 Three companies with deep economic moats to buy now
Opinion An economic moat can underpin a company's future returns. Here, Imran Sattar, portfolio manager at Edinburgh Investment Trust, selects three stocks to buy now