Is gold heading for my $1,400 target?
While the rally in gold looks promising, the market is not without danger. John C Burford assesses the risks of his next trade.
Get the latest financial news, insights and expert analysis from our award-winning MoneyWeek team, to help you understand what really matters when it comes to your finances.
You are now subscribed
Your newsletter sign-up was successful
Want to add more newsletters?

Twice daily
MoneyWeek
Get the latest financial news, insights and expert analysis from our award-winning MoneyWeek team, to help you understand what really matters when it comes to your finances.

Four times a week
Look After My Bills
Sign up to our free money-saving newsletter, filled with the latest news and expert advice to help you find the best tips and deals for managing your bills. Start saving today!
The gold market is showing some interesting patterns. The market on the daily chart is in a clear downtrend:
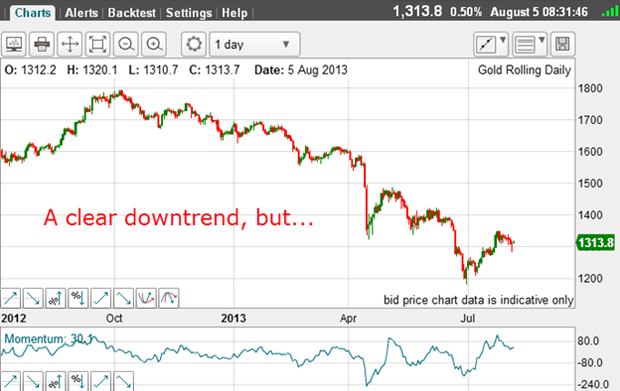
But the near-term shows a rally. This is perfectly normal following such a collapse. Markets do not go down in a straight line. We get relief rallies some are called dead cat bounces as some shorts take their profits and bargain-hunters' step in to buy at cheaper prices.
But could this small-scale rally turn into something more substantial?
MoneyWeek
Subscribe to MoneyWeek today and get your first six magazine issues absolutely FREE

Sign up to Money Morning
Don't miss the latest investment and personal finances news, market analysis, plus money-saving tips with our free twice-daily newsletter
Don't miss the latest investment and personal finances news, market analysis, plus money-saving tips with our free twice-daily newsletter
The odds, on the face of it, appear daunting.
Here is the hourly chart:
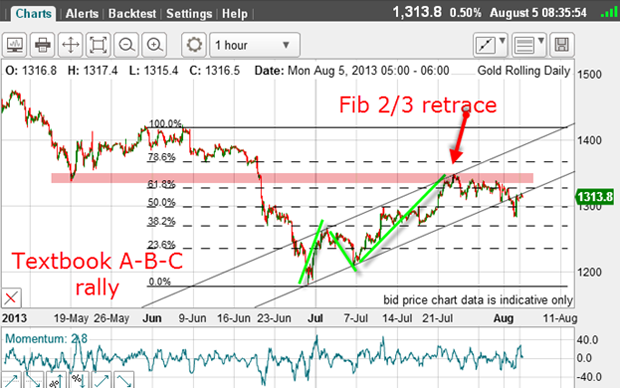
The rally has the classic A-B-C form with positive-momentum divergence at the C wave high. The C wave retraced a Fibonacci two thirds retracement, and we have a lower tramline break last week.
When we see A-B-Cs, that usually means the rally is a corrective move to the main trend.
Also, at the C wave high, the market has entered into stiff overhead chart resistance.
This would normally be a textbook short-selling set-up, expecting the bear market to kick back in.
But let us take a closer look:
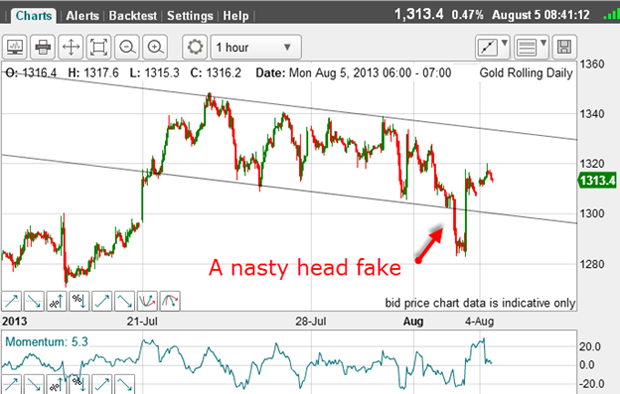
I have a tramline pair drawn in. But as I do not have many touch points, this isn't a textbook pair, although I do have a nice prior pivot point (PPP) on the lower line.
But there is a solid tramline break, followed by a head fake, where the market came roaring back into the trading channel.
All those traders who placed short-selling orders on the break are out of pocket and likely very surprised, as the trade looked like a high-probability one.
When I see a head fake this severe, I take notice! The market may not be ready to decline as I first thought.
So let us take an even closer look:
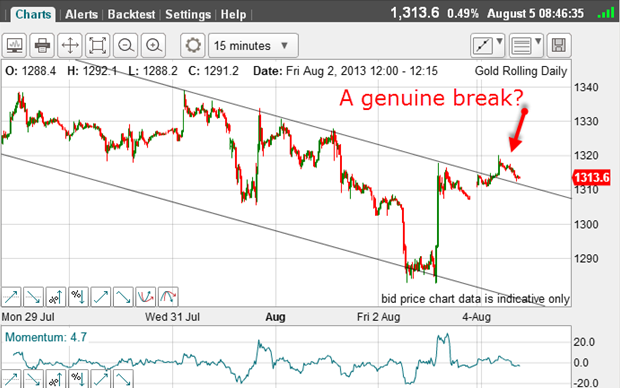
This 15-minute chart shows an excellent upper tramline with at least six touch points. This makes it a highly reliable one in my book.
And this morning, there was an upside break-out of this upper line.
So, if this is a genuine break-out, where do I think the rally will head towards?
Here are my tramlines on the daily:
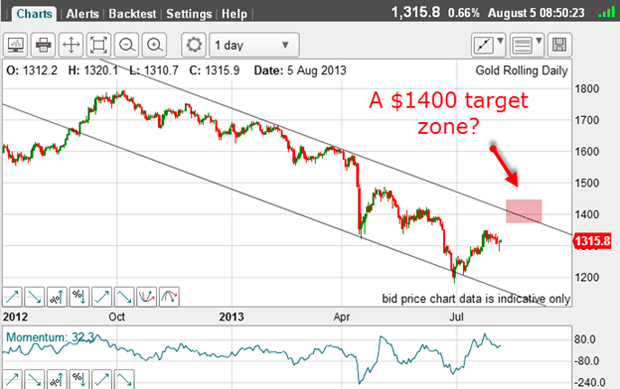
I have a good lower tramline complete with a PPP set back in August last year.
That puts an upside target in the $1,400 area.
Sentiment remains slightly bearish on gold, compared with the recent picture. Here is the latest commitments of traders (COT) data:
| (Contracts of 100 troy ounces) | Row 0 - Cell 1 | Row 0 - Cell 2 | Row 0 - Cell 3 | Open interest: 397,035 | ||||
| Commitments | ||||||||
| 154,519 | 126,153 | 19,841 | 188,832 | 214,606 | 363,192 | 360,600 | 33,843 | 36,435 |
| Changes from 07/23/13 (Change in open interest: -37,715) | ||||||||
| -6,678 | -853 | -5,450 | -21,401 | -30,323 | -33,529 | -36,626 | -4,186 | -1,089 |
| Percent of open in terest for each category of traders | ||||||||
| 38.9 | 31.8 | 5.0 | 47.6 | 54.1 | 91.5 | 90.8 | 8.5 | 9.2 |
| Number of traders in each category (Total traders: 274) | ||||||||
| 105 | 91 | 66 | 55 | 57 | 192 | 186 | Row 8 - Cell 7 | Row 8 - Cell 8 |
The hedge funds (non-commercials) have lightened up on their long positions, while maintaining a slightly bullish position.
So, this morning, there is an intriguing possibility that the gold market could rally further before hitting my upper tramline in the $1,400 area.
But of course, this break-out could be another head fake!
Sadly, I know of no method that can forecast whether a tramline break will be a head fake or a genuine one.
The only thing a trader can do is to exercise discipline in trade entry and place sensible protective stops. Then let the market gods do their work!
Get the latest financial news, insights and expert analysis from our award-winning MoneyWeek team, to help you understand what really matters when it comes to your finances.
John is is a British-born lapsed PhD physicist, who previously worked for Nasa on the Mars exploration team. He is a former commodity trading advisor with the US Commodities Futures Trading Commission, and worked in a boutique futures house in California in the 1980s.
He was a partner in one of the first futures newsletter advisory services, based in Washington DC, specialising in pork bellies and currencies. John is primarily a chart-reading trader, having cut his trading teeth in the days before PCs.
As well as his work in the financial world, he has launched, run and sold several 'real' businesses producing 'real' products.
-
 Average UK house price reaches £300,000 for first time, Halifax says
While the average house price has topped £300k, regional disparities still remain, Halifax finds.
-
 Barings Emerging Europe trust bounces back from Russia woes
Barings Emerging Europe trust has added the Middle East and Africa to its mandate, delivering a strong recovery, says Max King