Is the gold price heading lower in the charts?
Never use the news to guide you in your trades, says John C Burford. Gold's recent moves in the charts are testiment to that.
Get the latest financial news, insights and expert analysis from our award-winning MoneyWeek team, to help you understand what really matters when it comes to your finances.
You are now subscribed
Your newsletter sign-up was successful
Want to add more newsletters?

Twice daily
MoneyWeek
Get the latest financial news, insights and expert analysis from our award-winning MoneyWeek team, to help you understand what really matters when it comes to your finances.

Four times a week
Look After My Bills
Sign up to our free money-saving newsletter, filled with the latest news and expert advice to help you find the best tips and deals for managing your bills. Start saving today!
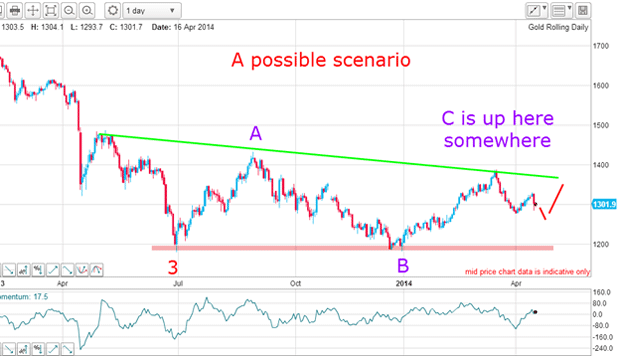
Last Wednesday, I covered the gold market.I explained how I managed to take a good profit out of my latest counter-trend long trade and was standing aside while I let the dust settle following the sharp break on 15 April. This was the chart last time:

Since the wave 3 low last summer, the market has been in a large consolidation zone described by the lines of my triangle. This is the wave 4 of the pattern.
Typically, fourth waves are complex and can give the active trader nightmares as the market whips one way and then the other. If you are trading breakouts, then it is common to be whipsawed to death. This is the most dangerous wave to swing trade!
MoneyWeek
Subscribe to MoneyWeek today and get your first six magazine issues absolutely FREE

Sign up to Money Morning
Don't miss the latest investment and personal finances news, market analysis, plus money-saving tips with our free twice-daily newsletter
Don't miss the latest investment and personal finances news, market analysis, plus money-saving tips with our free twice-daily newsletter
But there are ways to intelligently trade these minor swings, because with the knowledge that fourth waves usually contain several A-B-Cs both up and down, we are prepared.
Don't use logic to make a trade
So let's see if my best guess has been working out over the Easter break. Here is the hourly chart:

Note that when I drew in my best guess on the first chart, I knew nothing of the political tensions that could arise from the simmering Ukraine situation.
In the meantime, there have been fatal shootings at the Ukraine border and an escalation of the intensity of US warnings to Russia. This introduces the prospect of retaliation by Russia to possibly endanger gas supplies to the West.
Under this scenario, logic suggests that gold and crude oil would be expected to rally. Instead, they have fallen. Just yesterday, crude fell by a whopping $2.
Any trader using the news and logic - as a basis for trading would be suffering losses.
The one thing every trader should do
This is a stark illustration of why I rarely use the news (or fundamentals') for making trading decisions. It is the action of the other traders that I watch like a hawk not the news.
Basically, it is not my interpretation of the news that matters it is my reading of how the other traders react to the news that is important. This means that I have a large weight removed from my shoulders: I don't need to avidly follow the screeds of news articles on my markets.
The fact that gold and crude have been falling in the face of increased global tensions tells me that the markets are being driven by something stronger and there is no outside influence that can stop that trend.
This is the whole basis behind the wave principle the observation that market prices are patterned into waves that can be anticipated in advance, if skilled enough.
The market follows my script
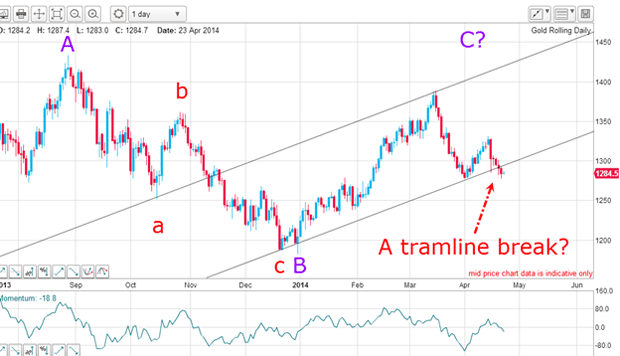
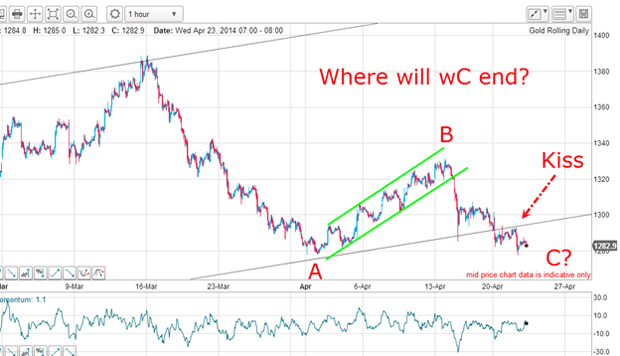
Since last Wednesday, the market has fallen below the lower tramline and is following my script perfectly. Let's see this in close-up on the hourly:

From the mid-March high, I have my A and B waves in place and the market currently is forming the final C wave. The big question is this: where will C terminate and reverse? If I can locate that point, I can cover my shorts and trade from the long side again.
Remember last time I noted that the big plunge from the B wave high to my lower tramline must have been a shock to the bulls' confidence. From that B wave high, the moves down have been sharp and swift, while the rallies have been weak.
Note that this behaviour is in sharp contrast to that exhibited in the B wave up, where rallies were sharp and dips were generally weak.
This is another clue that the path of least resistance is down and that we likely have further to go before my C wave turns. Reading the character of the market is a useful skill to develop.
What the markets are doing today
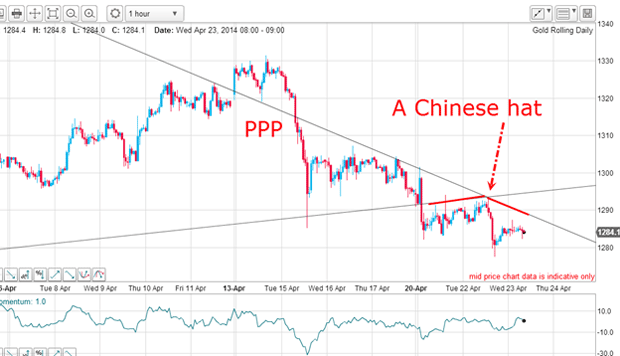
There is one more interesting chart pattern that formed yesterday:

I have a downtrend line drawn which sports a nice PPP. The market rallied to the intersection of this line with the major up-sloping tramline.
Where two tramlines intersect, I call that a Chinese hat. This is where resistance is augmented, since both lines are lines of resistance.Isn't that pretty?
Get the latest financial news, insights and expert analysis from our award-winning MoneyWeek team, to help you understand what really matters when it comes to your finances.
John is is a British-born lapsed PhD physicist, who previously worked for Nasa on the Mars exploration team. He is a former commodity trading advisor with the US Commodities Futures Trading Commission, and worked in a boutique futures house in California in the 1980s.
He was a partner in one of the first futures newsletter advisory services, based in Washington DC, specialising in pork bellies and currencies. John is primarily a chart-reading trader, having cut his trading teeth in the days before PCs.
As well as his work in the financial world, he has launched, run and sold several 'real' businesses producing 'real' products.
-
 Average UK house price reaches £300,000 for first time, Halifax says
While the average house price has topped £300k, regional disparities still remain, Halifax finds.
-
 Barings Emerging Europe trust bounces back from Russia woes
Barings Emerging Europe trust has added the Middle East and Africa to its mandate, delivering a strong recovery, says Max King