How to trade in the Wild West of the markets
Markets don't come much wilder than gold. John C Burford shows how to handle the swings in direction using his tramline trading methods.
Get the latest financial news, insights and expert analysis from our award-winning MoneyWeek team, to help you understand what really matters when it comes to your finances.
You are now subscribed
Your newsletter sign-up was successful
Want to add more newsletters?

Twice daily
MoneyWeek
Get the latest financial news, insights and expert analysis from our award-winning MoneyWeek team, to help you understand what really matters when it comes to your finances.

Four times a week
Look After My Bills
Sign up to our free money-saving newsletter, filled with the latest news and expert advice to help you find the best tips and deals for managing your bills. Start saving today!
The gold market is a heart-breaker. Many hopes are dashed on the seemingly wild swings that punctuate this market. It is the Wild West of the markets.
The price moves seem to bear no relationship with basic supply/demand factors. For instance in 2013, global demand rocketed with especially massive increases in China. Yet the price fell from $1,700 to $1,200 in the year a drop of 30%. As they say in the US go figure.
But there are ways to handle these swings and to profit thereby. Today, I'll show you how to do so in the gold market by using my tramline trading methods.
MoneyWeek
Subscribe to MoneyWeek today and get your first six magazine issues absolutely FREE

Sign up to Money Morning
Don't miss the latest investment and personal finances news, market analysis, plus money-saving tips with our free twice-daily newsletter
Don't miss the latest investment and personal finances news, market analysis, plus money-saving tips with our free twice-daily newsletter
Welcome to the wild, wild gold market
From this $1,190 high, the market fell steadily back towards my tramline, where it also converged with the 50% Fibonacci retrace. The other major factor was that my C wave was equal to my A wave just in this area. This was my chart then:
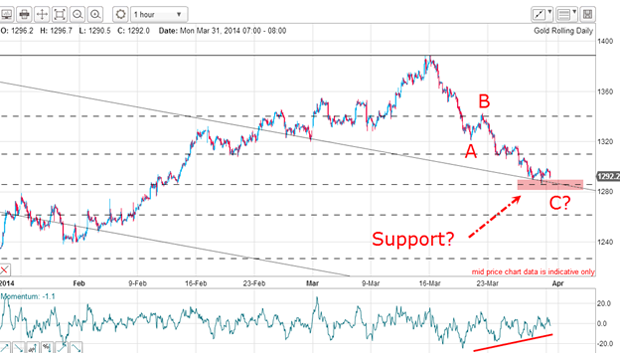
The positive-momentum divergence put the icing on the cake for a terrific case to be made to cover shorts and go long. But I needed proof that the market would find support there.
This is what I wrote:"One other piece of information: At last week's low, wave C equals wave A in height. Remember, another common relationship in an A-B-C corrective pattern is the equality of the A and C waves. This is significant.
"So it appears the odds are building up for a bounce from near current levels if my C wave has ended.Not only that, but the latest DSI readings have fallen sharply off the bullish extremes of two weeks ago.This is starting to look interesting!"
And interesting is what it became.
How I profited in this volatile market
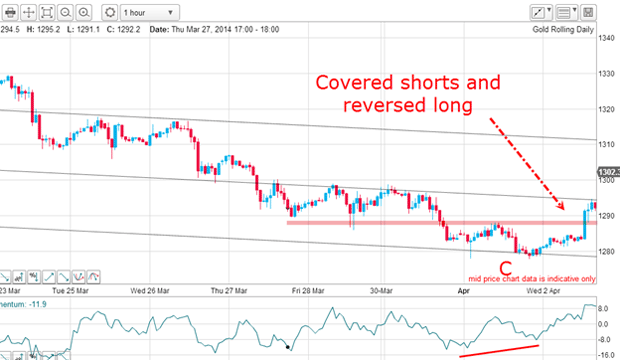
As the market moved up off the $1,280 low, I was able to draw a terrific tramline trio. The centre tramline has a good PPP (prior pivot point) and four accurate touch points. This makes it a very reliable line of support/resistance.
But the support/resistance line (marked in pink) is the significant level for trade timing purposes. If the market could move up through this resistance, it would then be transformed into support.
And if the market could punch up through my centre tramline, that too would become a support level. And with this enhanced support, a decent rally was on the cards.
There were thus two places to set stop-and-reverse orders for short trades: the break of the pink bar and then the break of the centre tramline. Protective stops could then be entered just below either line for a low-risk long trade.
With a budding rally in progress, my next step was to apply my Fibonacci levels to the most recent wave down:
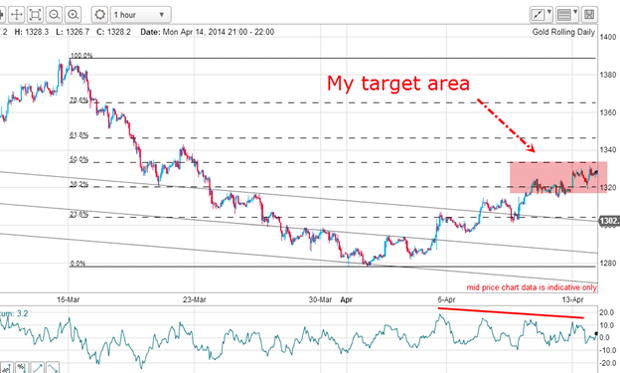
My first target was the Fibonacci 38% level where I determined to take partial profits using my split-bet strategy. And last Thursday, this level was hit and I duly took profits on one half of my long position for a tidy $30 profit.
I left the remaining half position open but moved my protective stop on it up to the $1,300 level. I chose this level because I wanted to give the market a little room to digest its recent gains and I am glad that I did because yesterday the market fell heavily, taking me out at my stop for a total profit of $35 on the trade.
Waiting for the dust to settle
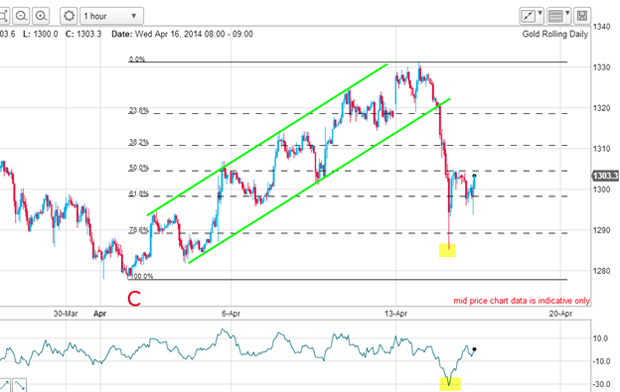
The sharp decline yesterday was not a total surprise to me, because the rally had been contained within the trading channel. It was a series of overlapping waves, which is characteristic of a corrective move, not an impulsive one.
An impulsive move would contain at least one very sharp rally which would not be retraced by a large correction. There were none in this rally.
Note the very oversold momentum reading at the spike low. This is a sign of a wash-out and heralds a recovery of some sort.
But there has been much damage done to the bulls' case and confidence!
Now I am out of the market and looking for a new trade. I have found from bitter experience that the best policy following a shock to the market is to stay out until the dust settles and that could be days away.
Lawlessness abounds in the gold market
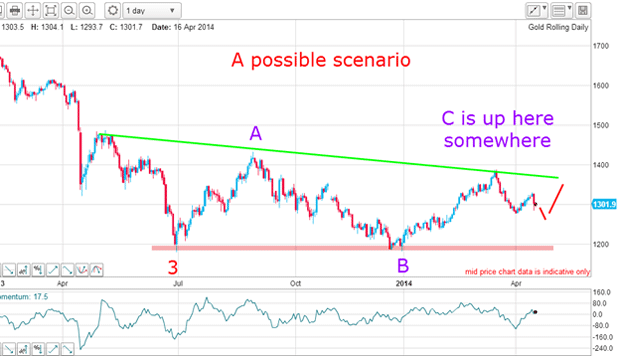
These are my Elliot wavesthatI have drawn previously. The market seems to be tracing out a large triangle. My C wave may possibly be in place at the mid-March sub-$1,400 high and the market may be working down from there.
But another possibility is that after one more dip (in an A-B-C off the sub-$1,400 high), the market may stage another rally attempt. In this case, the C wave and wave 4 (red) may lie closer to the $1,400 level before turning down in a wave 5. This would take the market down below the $1,180 support.
In the Wild West, there was little law and order!
Get the latest financial news, insights and expert analysis from our award-winning MoneyWeek team, to help you understand what really matters when it comes to your finances.
John is is a British-born lapsed PhD physicist, who previously worked for Nasa on the Mars exploration team. He is a former commodity trading advisor with the US Commodities Futures Trading Commission, and worked in a boutique futures house in California in the 1980s.
He was a partner in one of the first futures newsletter advisory services, based in Washington DC, specialising in pork bellies and currencies. John is primarily a chart-reading trader, having cut his trading teeth in the days before PCs.
As well as his work in the financial world, he has launched, run and sold several 'real' businesses producing 'real' products.
-
 Can mining stocks deliver golden gains?
With gold and silver prices having outperformed the stock markets last year, mining stocks can be an effective, if volatile, means of gaining exposure
-
 8 ways the ‘sandwich generation’ can protect wealth
People squeezed between caring for ageing parents and adult children or younger grandchildren – known as the ‘sandwich generation’ – are at risk of neglecting their own financial planning. Here’s how to protect yourself and your loved ones’ wealth.