The best time to trade against hedge funds
Cumbersome hedge funds are prone to making mistakes, says John C Burford. Swift-footed swing traders can take advantage.
Get the latest financial news, insights and expert analysis from our award-winning MoneyWeek team, to help you understand what really matters when it comes to your finances.
You are now subscribed
Your newsletter sign-up was successful
Want to add more newsletters?

Twice daily
MoneyWeek
Get the latest financial news, insights and expert analysis from our award-winning MoneyWeek team, to help you understand what really matters when it comes to your finances.

Four times a week
Look After My Bills
Sign up to our free money-saving newsletter, filled with the latest news and expert advice to help you find the best tips and deals for managing your bills. Start saving today!
I will update the gold picture this morning, because the market has provided a stark illustration of what happens when hedge funds get it wrong - and they do that quite often.
Hedge funds are among the biggest players in the market, so we need to keep track of their activities. As I have pointed out, they are largely trend-followers. They are momentum traders and use trading programmes that track the momentum of the market.
And because they trade in huge quantities, they are not as nimble as small traders. This means that it takes much longer for the hedgies to change tack and that's one reason they are often wrong at market turns. So today I'll tell you how investors can benefit from their mistakes.
MoneyWeek
Subscribe to MoneyWeek today and get your first six magazine issues absolutely FREE

Sign up to Money Morning
Don't miss the latest investment and personal finances news, market analysis, plus money-saving tips with our free twice-daily newsletter
Don't miss the latest investment and personal finances news, market analysis, plus money-saving tips with our free twice-daily newsletter
Why small traders love a good story
Why? Because small traders just love a good story! And this group can enhance market moves. In December, they had fallen in love with the gold is bad' story. Sentiment measures were pointing to record low levels of bearishness, with the Daily Sentiment Index (DSI) reaching an extreme low at the 5% level at one point.
There were widespread forecasts of sub-$1,000 gold.
Then in January, the market started turning up and sentiment turned with it.
I used this information to position on the long side of the market. The oversold condition was correcting as a new gold story was finding favour (gold is good). This new story was based on the heightened Ukraine conflict and reports that China was buying physical metal in volume.
The hedge funds were at the fore in predicting $1,400 gold, which was my original target in early January.
And as the market approached this target, DSI readings had reached an extreme 85% bullish level.
But as I wrote, this target was missed (as I forecast) and in just ten days, the market fell $100 to last week's low of $1,285.
How to know what hedge funds are doing
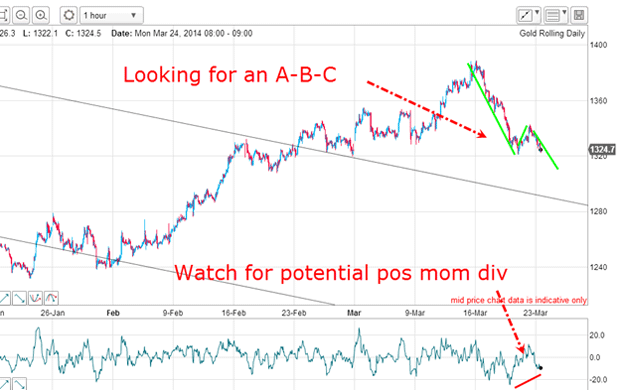
In my 24 March post, the market was declining off the $1,388 high where the COT data was showing that the hedge funds had built up a four-to-one bullish position.
Here is the latest COT data which refers to the 25 March picture:
| (Contracts of 100 Troy ounces) | Row 0 - Cell 1 | Row 0 - Cell 2 | Row 0 - Cell 3 | Open interest: 398,264 | ||||
| Commitments | ||||||||
| 169,083 | 51,766 | 30,361 | 159,979 | 287,600 | 359,423 | 369,727 | 38,841 | 28,537 |
| Changes from 03/18/14 (Change in open interest: -22,362) | ||||||||
| -14,241 | 5,256 | -2,338 | -4,314 | -22,627 | -20,893 | -19,709 | -1,469 | -2,653 |
| Percent of open in terest for each category of traders | ||||||||
| 42.5 | 13.0 | 7.6 | 40.2 | 72.2 | 90.2 | 92.8 | 9.8 | 7.2 |
| Number of traders in each category (Total traders: 280) | ||||||||
| 124 | 75 | 73 | 51 | 58 | 212 | 177 | Row 8 - Cell 7 | Row 8 - Cell 8 |
The non-commercials (largely hedge funds) sold a large chunk of their longs and increased their shorts last week. That means they now hold only three longs to one short.
But has this driven out the froth so that the market can stage a rally?
Will the gold support hold?

If the larger trend was still up, then I expect the decline to have an A-B-C form.
And if an A-B-C did form, a positive-momentum divergence would add strength to the ongoing rally case.
This is the updated chart this morning:

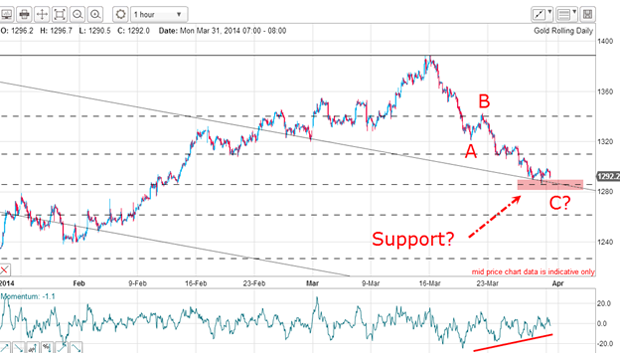
Since last time, the market has declined on cue and precisely to the meeting of the tramline and the Fibonacci 50% level, where the decline has retraced 50% of the entire rally off the 31 December low.
Remember, the 50% level is a common retracement if the main trend is still intact. Also, if my tramlines are still working, there should be a kiss on it before the uptrend resumes.
And the positive-momentum divergence I had suggested last time has appeared (red bar).
Gold is starting to look interesting
So it appears the odds are building up for a bounce from near current levels if my C wave has ended.
Not only that, but the latest DSI readings have fallen sharply off the bullish extremes of two weeks ago.
This is starting to look interesting!
Get the latest financial news, insights and expert analysis from our award-winning MoneyWeek team, to help you understand what really matters when it comes to your finances.
John is is a British-born lapsed PhD physicist, who previously worked for Nasa on the Mars exploration team. He is a former commodity trading advisor with the US Commodities Futures Trading Commission, and worked in a boutique futures house in California in the 1980s.
He was a partner in one of the first futures newsletter advisory services, based in Washington DC, specialising in pork bellies and currencies. John is primarily a chart-reading trader, having cut his trading teeth in the days before PCs.
As well as his work in the financial world, he has launched, run and sold several 'real' businesses producing 'real' products.
-
 MoneyWeek news quiz: Can you get smart meter compensation?
Smart meter compensation rules, Premium Bonds winners, and the Bank of England’s latest base rate decision all made the news this week. How closely were you following it?
-
 Adventures in Saudi Arabia
Travel The kingdom of Saudi Arabia in the Middle East is rich in undiscovered natural beauty. Get there before everybody else does, says Merryn Somerset Webb