Mario Draghi (the European Central Bank (ECB) president) has been jawboning the euro lower at least, that is the conventional view and the EUR/USD has been obliging him by edging lower off the recent 1.40 top.
In my post of 25 July, I wondered if the market was about to stage a rally then.
Today, I want to focus on the possibility for such a rally now.
Try 6 free issues of MoneyWeek today
Get unparalleled financial insight, analysis and expert opinion you can profit from.

Sign up to Money Morning
Don't miss the latest investment and personal finances news, market analysis, plus money-saving tips with our free twice-daily newsletter
Don't miss the latest investment and personal finances news, market analysis, plus money-saving tips with our free twice-daily newsletter
Is a reversal near?

I had a good lower tramline together with a very iffy upper one, about which I was not confident at all. Remember, you need three or more accurate touch points to have confidence in a tramline.

But the positive-momentum divergence gave me an early warning sign that a rally was due, if not on that date.
So let me back up and examine the bigger picture on the daily chart:
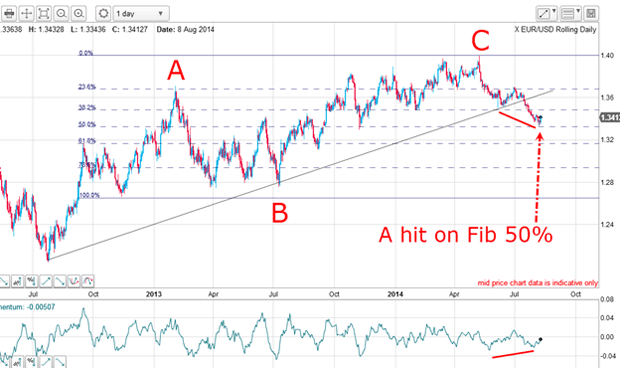
Since 26 July, the market has moved lower, but on a large positive-momentum divergence on this daily chart. The market has also made an accurate hit on the Fibonacci 50% retrace of the wave up from the November 2012 low.
Of course, the main feature of the chart is the break of the wedge line last month. This is a line to watch because markets have a habit of rising back to the line in a kiss. I have shown several examples of kisses in recent posts. They are excellent areas to align with the new trend at low risk.
So now the market has hit the Fibonacci support on a momentum divergence and the odds have swung to the upside.
And if trading short-term, the Fibonacci hit last week was an excellent place to take profits of course.
My tramline rules give us a tradable event
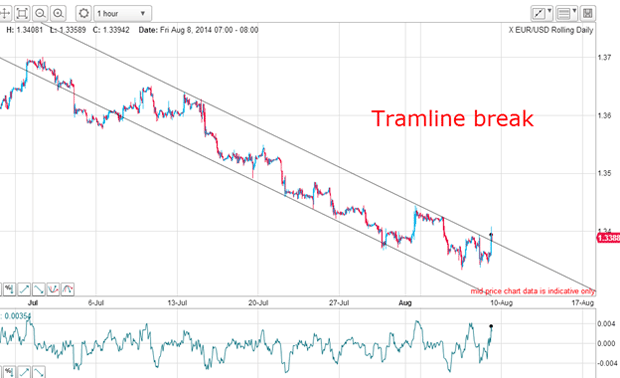
I now have an excellent tramline pair! My upper line sports five accurate touch points and the lower line is similarly endowed and has a couple of PPPs (prior pivot points). This qualifies the tramline pair as being very reliable.
And on Friday, the market broke above the upper line, thereby breaking resistance there. That break was a tradable event according to my tramline trading rules.
What the sentiment data tells us
Here is the latest COT (commitments of traders) data:
| (Contracts of EUR 125,000) | Row 0 - Cell 1 | Row 0 - Cell 2 | Row 0 - Cell 3 | Open interest: 379,004 | ||||
| Commitments | ||||||||
| 55,179 | 183,926 | 6,607 | 283,379 | 104,329 | 345,159 | 294,862 | 33,845 | 84,142 |
| Changes from 07/29/14 (Change in open interest: 22,139) | ||||||||
| -1,383 | 19,289 | 976 | 23,413 | -48 | 23,006 | 20,217 | -867 | 1,922 |
| Percent of open in terest for each category of traders | ||||||||
| 14.6 | 48.5 | 1.7 | 74.8 | 27.5 | 91.1 | 77.8 | 8.9 | 22.2 |
| Number of traders in each category (Total traders: 207) | ||||||||
| 33 | 88 | 28 | 53 | 60 | 104 | 159 | Row 8 - Cell 7 | Row 8 - Cell 8 |
The speculators were already heavily short, but in the week to 5 August, they increased their short bets aggressively. They are now approximately three-to-one bearish (opposite for the smart money commercials!). This is tending towards a lopsided state that usually heralds a decent reversal.
If the data showed a more even distribution of long/short speculator positions, then it would indicate any rally would likely be limited. But here, a big short squeeze appears possible.
Markets have long memories
But as we recall from the QE saga in the United States, the dollar actually rose in value during much of the QE money printing' operations. One reason is that the Fed did not increase by one dollar the money supply by doing QE. They exchanged bonds for bank reserves that cannot leak into the general money supply.
Spending money is created only by the commercial banks when they extend loans to borrowers. If there is little or no loan demand as exists currently in the eurozone the money supply will not increase and there will be no inflationary effect from conventional QE.
Of course, the ECB could engage in unconventional QE which could inject fresh funds into the real economies of Europe. Unlike the Fed's QE impact on the dollar, that would have very bearish implications for the euro, and is one reason EUR/USD has been weak of late.
In any case, with sentiment very bearish the euro and the market having entered chart support, a good bounce appears likely:
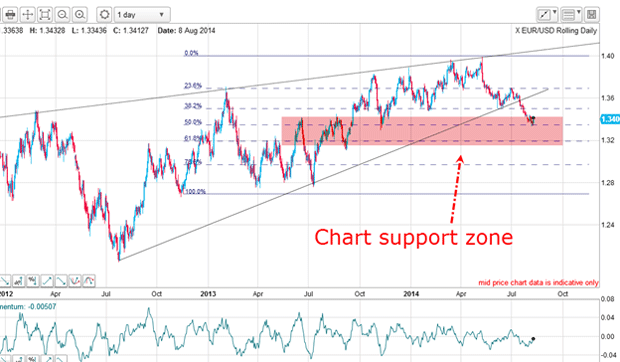
Chart support is marked in pink and its boundaries are marked by the highs and lows of the volatile trading about a year ago.
Remember, markets have long memories.