The euro remains wobbly vs the US dollar
John C Burford demonstrates the sheer profit-making power of Elliott wave theory with a trade in the euro.
Get the latest financial news, insights and expert analysis from our award-winning MoneyWeek team, to help you understand what really matters when it comes to your finances.
You are now subscribed
Your newsletter sign-up was successful
Want to add more newsletters?

Twice daily
MoneyWeek
Get the latest financial news, insights and expert analysis from our award-winning MoneyWeek team, to help you understand what really matters when it comes to your finances.

Four times a week
Look After My Bills
Sign up to our free money-saving newsletter, filled with the latest news and expert advice to help you find the best tips and deals for managing your bills. Start saving today!
Today, I want to follow up on the euro story because it is demonstrating the sheer profit-making power of using the basic Elliott wave concepts that are embodied in my tramline trading method the same system I teach in my Trade for Profit Academy.
On 18 July, I outlined my case to expect a sharp fall in the EUR/USD rate. This was based on the Elliott wave labels I placed on recent action.
Basically, from the 1.40 key reversal high on 8 May, I could count waves 1 and 2 and concluded the market was at the start of wave 3.
MoneyWeek
Subscribe to MoneyWeek today and get your first six magazine issues absolutely FREE

Sign up to Money Morning
Don't miss the latest investment and personal finances news, market analysis, plus money-saving tips with our free twice-daily newsletter
Don't miss the latest investment and personal finances news, market analysis, plus money-saving tips with our free twice-daily newsletter
This was the chart then:
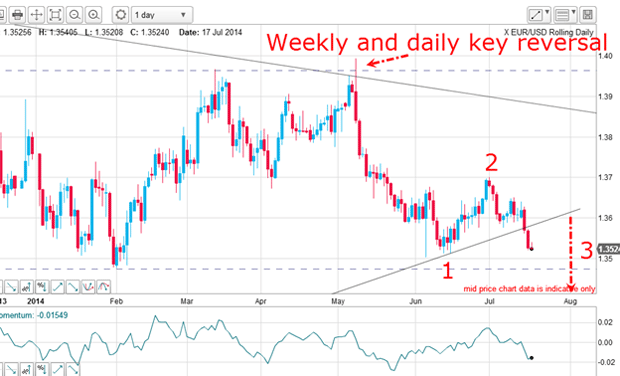
It shows the very steep decline off the 8 May top to my wave 1 low, then the rally in wave 2 and the decline in a budding wave 3. Remember, third waves are invariably long and strong. In fact, that is their signature. If you see a market move rapidly with few set-backs, you are probably in a third wave of some sort.
Note also the lower wedge line had been broken, which gave a sell signal.
Not only that, but there was a smaller scale wave pattern developing. This was the hourly chart I showed:
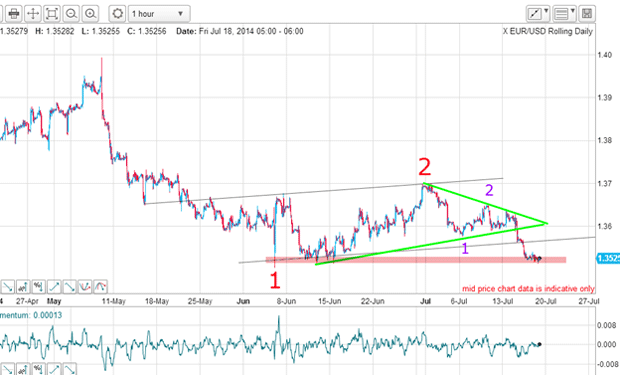
The break of the lower green wedge line and the lower tramline were also short-selling triggers.
The market was then testing the pink chart support and in two third waves down.
Where we are today
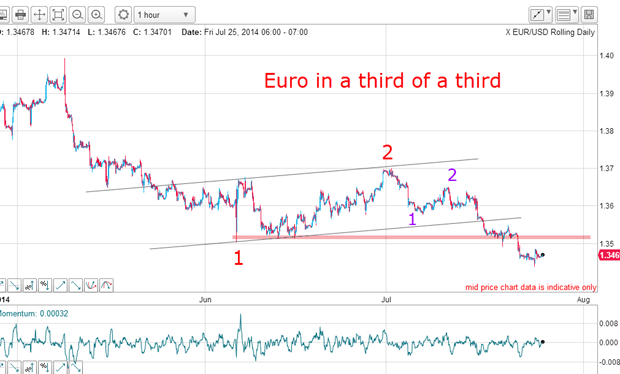
Right on cue, the pink support zone was broken to confirm my third of a third' forecast.
Already, all of the short trades taken on the above signals are in profit.
The bigger picture
Here is the daily chart:
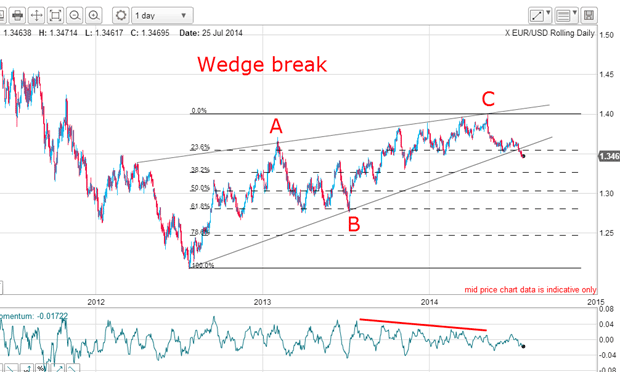
The run-up in the C wave occurred on weaker momentum highs, which warned of an impending reversal which was made at the 1.40 level.
Now, with the break of my lower wedge line, the market has broken the Fibonacci 23% support (which was where my large wave 1 bottomed). It is now heading for the next Fibonacci support at the 38% level in the 1.3260 area.
The 1.3260 level now becomes my first major target.
But of course, markets rarely oblige by heading directly for a target in a straight line. We must expect some rallies along the way.
Will there be a relief rally?
The latest COT figures are over a week old (the latest data is released today and every Friday for a snapshot as of the previous Tuesday).
| CONTRACTS OF EUR 125,000 | Row 0 - Cell 1 | Row 0 - Cell 2 | Row 0 - Cell 3 | Open interest: 310,661 | ||||
| Commitments | ||||||||
| 59,506 | 122,352 | 5,590 | 212,426 | 109,017 | 277,522 | 236,959 | 33,139 | 73,702 |
| Changes from 07/08/14 (Change in open interest: 16,280) | ||||||||
| 7,911 | 11,492 | 111 | -8,311 | 1,812 | 16,333 | 13,415 | -53 | 2,865 |
| Percent of open interest for each category of traders | ||||||||
| 19.2 | 39.4 | 1.8 | 68.4 | 35.1 | 89.3 | 76.3 | 10.7 | 23.7 |
| Number of traders in each category (Total traders: 191) | ||||||||
| 37 | 72 | 24 | 52 | 52 | 106 | 111 | Row 8 - Cell 7 | Row 8 - Cell 8 |
This data shows that the large specs (non-commercials) are about two-to-one bearish, since they hold about twice as many short futures positions as long. The small specs (non-reportables) are slightly more bearish with a ratio of 2.2 short to long.
Remember, the specs are the most price-sensitive cohort. The commercials (banks, trade houses, large exporting companies) are far less price sensitive because they are usually passing risk onto the specs by their hedging activities.
This means that any adverse move in the market would probably cause many specs to cover their shorts, thereby extending rallies by their short covering.
This data tells me that the market is vulnerable to short squeezes and to expect significant relief rallies.
Also, a glance at the above chart shows the bull move off the 2012 low was a choppy affair with large swings both up and down. I have no reason to suspect the descent to be anything different. I am therefore prepared for major rallies.
But is there just such a rally imminent?
Is a reversal near?
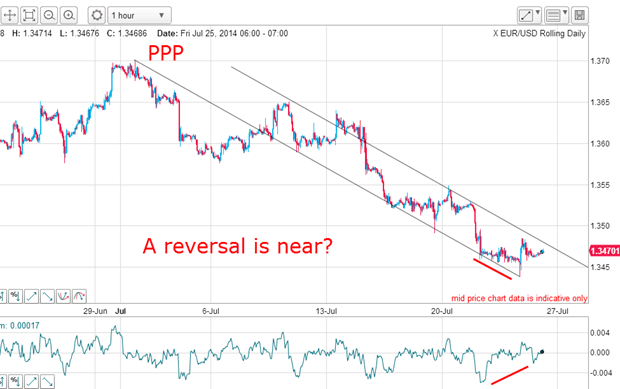
Remember, tramlines are a basic building block of my trading method. I have a superb lower tramline with a great prior pivot point (PPP) at the 1.37 high and multiple touch points, making it a very reliable line of support.
My upper tramline is speculative at this stage with the messy overshoots around 13 July.
But the key observation here is the large positive momentum divergence at yesterday's low, which was a spike move right to my lower tramline support. When I see such a divergence coming after a strong move to a lower tramline, I suspect a reversal is at hand.
That is why I decided to take partial profits on my short-term short trades on the spike move below 1.3450. But the larger trend remains down and rallies are to be sold (until proven otherwise).
And if a relief rally emerges here, I will be applying my Fibonacci levels to forecast where a rally would likely terminate.
Get the latest financial news, insights and expert analysis from our award-winning MoneyWeek team, to help you understand what really matters when it comes to your finances.
John is is a British-born lapsed PhD physicist, who previously worked for Nasa on the Mars exploration team. He is a former commodity trading advisor with the US Commodities Futures Trading Commission, and worked in a boutique futures house in California in the 1980s.
He was a partner in one of the first futures newsletter advisory services, based in Washington DC, specialising in pork bellies and currencies. John is primarily a chart-reading trader, having cut his trading teeth in the days before PCs.
As well as his work in the financial world, he has launched, run and sold several 'real' businesses producing 'real' products.
-
 UK interest rates live: experts expect MPC to hold rates
The Bank of England’s Monetary Policy Committee (MPC) meets today to decide UK interest rates. The last meeting resulted in a cut, but experts think there is little chance of interest rates falling today.
-
 MoneyWeek Talks: The funds to choose in 2026
Podcast Fidelity's Tom Stevenson reveals his top three funds for 2026 for your ISA or self-invested personal pension