How tramline kisses give your trading an edge
John C Burford explains what trendline 'kisses' are in the charts and how swing traders can use them to profit.
Get the latest financial news, insights and expert analysis from our award-winning MoneyWeek team, to help you understand what really matters when it comes to your finances.
You are now subscribed
Your newsletter sign-up was successful
Want to add more newsletters?

Twice daily
MoneyWeek
Get the latest financial news, insights and expert analysis from our award-winning MoneyWeek team, to help you understand what really matters when it comes to your finances.

Four times a week
Look After My Bills
Sign up to our free money-saving newsletter, filled with the latest news and expert advice to help you find the best tips and deals for managing your bills. Start saving today!
Today, I want to cover tramline kisses and how you can play them for profit.Both trendlines and tramlines are sloping lines that are lines of resistance or support.
In a bull market, the line joining the lows is a line of support. That's because every time the market declines from above to touch the line, the market reverses back up and creates a touch point. In a bear market, the line joining the highs is a line of resistance.
But eventually, the line is penetrated and the market breaks through. The line that was support (or resistance) now becomes resistance (or support). Basically, the line has flipped character on the break.
MoneyWeek
Subscribe to MoneyWeek today and get your first six magazine issues absolutely FREE

Sign up to Money Morning
Don't miss the latest investment and personal finances news, market analysis, plus money-saving tips with our free twice-daily newsletter
Don't miss the latest investment and personal finances news, market analysis, plus money-saving tips with our free twice-daily newsletter
But often, the market does not move away from the line break in relentless fashion. Instead, it often comes back and plants a kiss (touch point) on the line and then bids it farewell as it moves away again.
This phenomenon can be observed in charts of all time frames, and today, I will show you some examples.
Example one: GBP/EUR

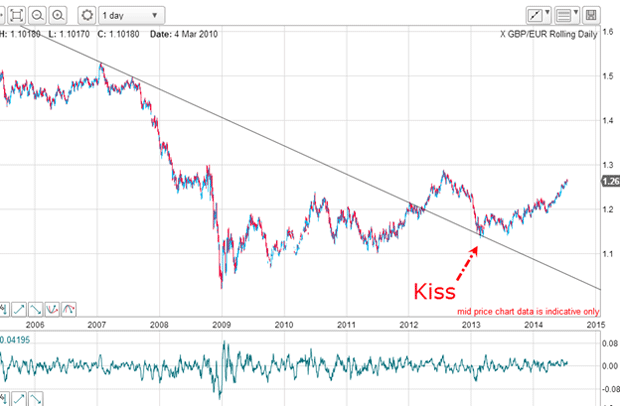
I have an excellent trendline drawn off the two 2007 touch points and the cluster in 2012. This is a five-year trendline and hence is to be respected. In early 2012, the market broke up through the line (which was resistance) and the trend had turned up.
But later that year, the market encountered heavy selling (the euro was well supported as it came back from the dead that year) and the GBP/EUR declined, but only to the upper side of the trendline. That touch created a textbook kiss and the support on that line was enough to turn the market trend back up again.
If you knew nothing about the background data surrounding the two currencies, you still could have made a low-risk trade at that kiss and that trade would be in considerable profit today.
Example two: AUS/USD

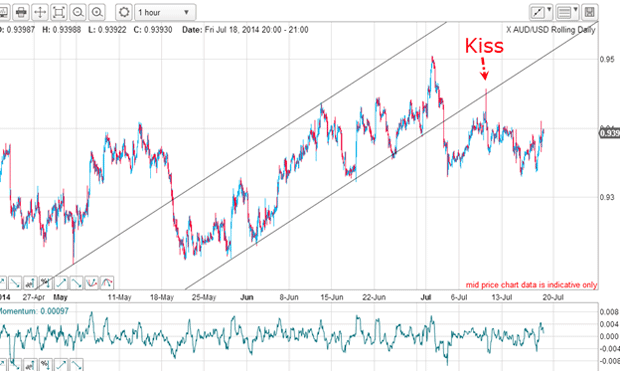
I have drawn in my tramline pair with an excellent lower tramline which has multiple touch points (the Aussie is notorious for spiky moves, so accurate touches are not usual). The market broke the lower tramline (support) on 3 July, consolidated the move and then moved back up for a kiss on the lower tramline (now resistance).
Note that this kiss occurred on a spike move, indicating buying exhaustion.
If you draw in the third tramline, you will find the market has made a kiss on that line and is testing it as I write. Go ahead and verify that for yourself.
Example three: CAD/JPY

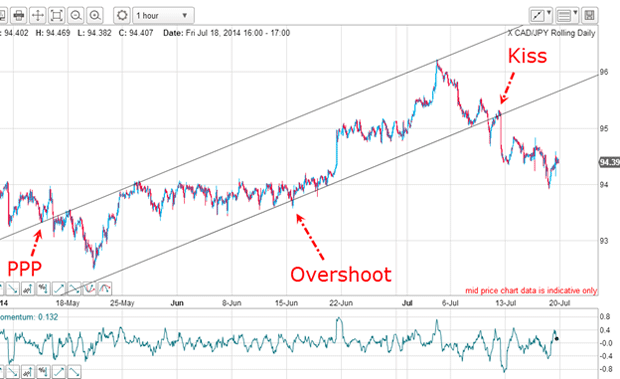
I have a good upper tramline with accurate touchpoints. My lower tramline is not so wonderful, with an overshoot and not many touch points. But when the market broke it on 10 July, it rallied back to the line, planted a kiss and made a scalded-cat bounce down. A low-risk trade entered at the kiss would now be in good profit.
As in the above example, if you draw in your third tramline, you will find that the market has just made a kiss on that tramline and is heading down as I write. That was another possible low-risk trade entry.
Example four: EUR/NOK

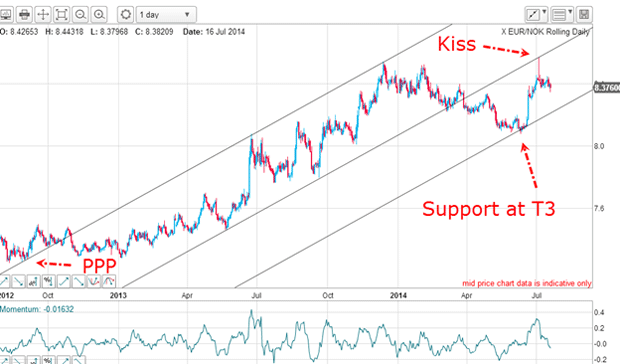
I have a terrific two-year-old upper tramline with solid PPP (prior pivot point) and the two major highs as very accurate touch points. The centre tramline was broken on 28 March and the new downtrend moved the market down to a precise hit on the third tramline, where it met support.
The market rallied but only to the underside of the centre tramline, where it planted a spiky kiss and is currently backing off in a scalded-cat bounce. That was another excellent low-risk trade entry.
Why I love kisses
You see, at all other points on the chart (except at the touch points), there are very few places you can enter trades at low risk using close stops. That is an absolute requirement for swing trading.
I do not want to enter a market on a hunch. I need an objective, systematic method that I can employ time after time in any market and under any conditions. This is what this method gives me.
Get the latest financial news, insights and expert analysis from our award-winning MoneyWeek team, to help you understand what really matters when it comes to your finances.
John is is a British-born lapsed PhD physicist, who previously worked for Nasa on the Mars exploration team. He is a former commodity trading advisor with the US Commodities Futures Trading Commission, and worked in a boutique futures house in California in the 1980s.
He was a partner in one of the first futures newsletter advisory services, based in Washington DC, specialising in pork bellies and currencies. John is primarily a chart-reading trader, having cut his trading teeth in the days before PCs.
As well as his work in the financial world, he has launched, run and sold several 'real' businesses producing 'real' products.
-
 Average UK house price reaches £300,000 for first time, Halifax says
While the average house price has topped £300k, regional disparities still remain, Halifax finds.
-
 Barings Emerging Europe trust bounces back from Russia woes
Barings Emerging Europe trust has added the Middle East and Africa to its mandate, delivering a strong recovery, says Max King