Is the Dow's rally over?
The Dow Jones's recent rally looks to have topped out. So is the next trend firmly down? John C Burford looks at where the index might go next.
Get the latest financial news, insights and expert analysis from our award-winning MoneyWeek team, to help you understand what really matters when it comes to your finances.
You are now subscribed
Your newsletter sign-up was successful
Want to add more newsletters?

Twice daily
MoneyWeek
Get the latest financial news, insights and expert analysis from our award-winning MoneyWeek team, to help you understand what really matters when it comes to your finances.

Four times a week
Look After My Bills
Sign up to our free money-saving newsletter, filled with the latest news and expert advice to help you find the best tips and deals for managing your bills. Start saving today!
What a difference a weekend makes!
When I covered the Dow on Friday, I made a case for the rally to top out at 12,250. Since then, the twists and turns of the Greek drama have produced polar reactions from investors from philia to phobia in only a few hours.
At yesterday's low, the Dow had retreated by more than 600 pips from Thursday's high. And that followed a record daily gain on Thursday!
MoneyWeek
Subscribe to MoneyWeek today and get your first six magazine issues absolutely FREE

Sign up to Money Morning
Don't miss the latest investment and personal finances news, market analysis, plus money-saving tips with our free twice-daily newsletter
Don't miss the latest investment and personal finances news, market analysis, plus money-saving tips with our free twice-daily newsletter
With markets so volatile, you need to be constantly on your toes if you are to trade successfully.
Satisfyingly, the methods that I employ to analyse and forecast are working, even in these tricky conditions.
OK, so I have a correct call for the top, and I am short. On Friday, I also mentioned that,"If I was a more conservative trader, I would want to wait for the potential tramline break at the 11,900 area about 300 pips lower than the current market".
This level has been breached, and even conservative traders are short.
Where is the Dow likely to go now?
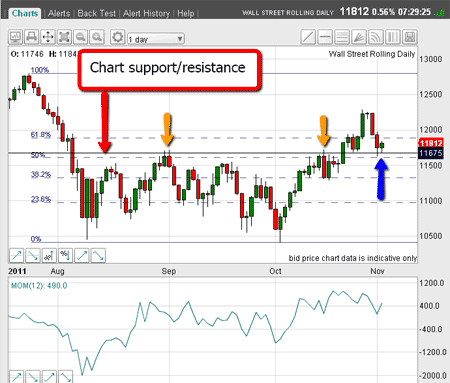
Let's zoom in on the decline of the past few days. Here is the daily chart showing last week's top and the current pull-back.

(Click on the chart for a larger version)
Is there a method for predicting the likely area where the decline could be stopped? The answer is yes.
On the chart, I have drawn in the horizontal line at the 11,675 area. Note that during the congestive trading in the summer, the rallies were stopped right at this level (I have marked this by the yellow arrows).
This type of resistance is called chart resistance.
This action showed that this level was going to be very tough to break. But a break did occur on the up-thrust on 21 October.
Now, what was previously resistance now becomes support.
Why is this? One of the reasons is that short-sellers, who are seeing the market move up against them, are anxious to reduce their losses if the market can pull back a little.
This buying puts a floor under the pull-backs.
And that is what we saw yesterday when the market dipped to this level and is currently in rally mode (blue arrow).
So, if I were a short-term trader who was short from near the top I could take profits near to this support area for a very quick gain of 500 pips or so.
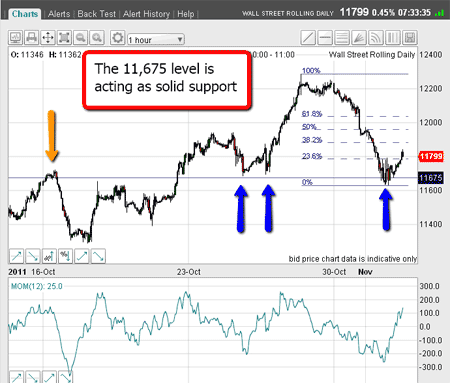
Here is the action on the hourly chart:

The pull-backs to the blue arrows are sheer textbook.
Could this be the start of a major wave down?
OK, we are seeing a rally from a deeply oversold condition. Is this the start of a major wave down? That is the crucial question for all traders.
To give me clues, I will go to my Elliott wave ideas. Remember, I forecast last week's top partly based on an Elliott wave A-B-C interpretation, so the theory is standing me in good stead.
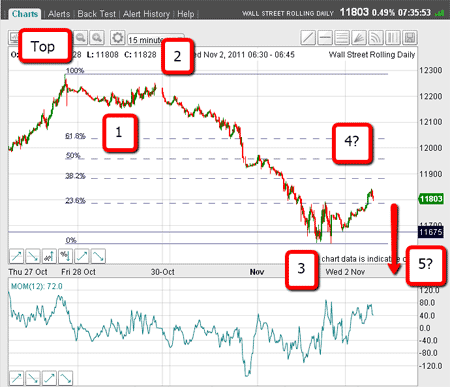
Here is the 15-minute chart showing the decline from the top:

I have my two good anchor points for drawing in my Fibonacci levels.
If you need to see how I use Fibonacci, watch my video tutorial.
Trader tip: when I have identified my high and low anchor points, I always draw in the Fibonacci retrace levels to identify possible turning points.
Right away, I can count waves 1, 2 and 3. Wave 3 is textbook it is long and strong. As I write, the market is rallying in a likely wave 4.
When that wave tops out, I expect a move to a new low beneath the 11,675 level in a final wave 5, with a possible positive momentum divergence.
If this happens, that would confirm the main trend is now down.
After wave 5 is in, we should see a major rally in an A-B-C format (or variation).
That is my ideal scenario.
Here, longer-term traders will be sitting tight on their short trades, and shorter-term traders will be looking for wave 4 to finish and then re-establish short positions.
However, this Greek drama has not reached the catharsis stage, and in any case, the next scene is shifting to Italy. Markets will remain highly volatile.
But no matter what surprises lie in store, I shall be focusing on my charts for guidance in my trading.
If you're a new reader, or need a reminder about some of the methods I refer to in my trades, then do have a look at my introductory videos:
The essentials of tramline trading
An introduction to Elliott wave theory
Don't miss my next trading insight. To receive all my spread betting blog posts by email, as soon as I've written them, just sign up here .
Get the latest financial news, insights and expert analysis from our award-winning MoneyWeek team, to help you understand what really matters when it comes to your finances.
John is is a British-born lapsed PhD physicist, who previously worked for Nasa on the Mars exploration team. He is a former commodity trading advisor with the US Commodities Futures Trading Commission, and worked in a boutique futures house in California in the 1980s.
He was a partner in one of the first futures newsletter advisory services, based in Washington DC, specialising in pork bellies and currencies. John is primarily a chart-reading trader, having cut his trading teeth in the days before PCs.
As well as his work in the financial world, he has launched, run and sold several 'real' businesses producing 'real' products.
-
 Can mining stocks deliver golden gains?
With gold and silver prices having outperformed the stock markets last year, mining stocks can be an effective, if volatile, means of gaining exposure
-
 8 ways the ‘sandwich generation’ can protect wealth
People squeezed between caring for ageing parents and adult children or younger grandchildren – known as the ‘sandwich generation’ – are at risk of neglecting their own financial planning. Here’s how to protect yourself and your loved ones’ wealth.