The Dow extends to another major resistance level
After a huge, unexpected rally this week, where will the Dow go next? John C Burford investigates and suggests the best way to play its next move.
Get the latest financial news, insights and expert analysis from our award-winning MoneyWeek team, to help you understand what really matters when it comes to your finances.
You are now subscribed
Your newsletter sign-up was successful
Want to add more newsletters?

Twice daily
MoneyWeek
Get the latest financial news, insights and expert analysis from our award-winning MoneyWeek team, to help you understand what really matters when it comes to your finances.

Four times a week
Look After My Bills
Sign up to our free money-saving newsletter, filled with the latest news and expert advice to help you find the best tips and deals for managing your bills. Start saving today!
We now have the market's initial reaction to the eurozone bail-out plan and it was extremely bullish. Many bearish traders were caught out and took big losses.
Yesterday, I showed all three of my markets had reached important Fibonacci levels in the morning. By the close of play, those levels had been swept away, overcoming any resistance they represented like a steamroller over a tin can!
It was good that I was watching from the sidelines without a position, but I did feel badly about missing out on one of the biggest daily rallies for many a year.
MoneyWeek
Subscribe to MoneyWeek today and get your first six magazine issues absolutely FREE

Sign up to Money Morning
Don't miss the latest investment and personal finances news, market analysis, plus money-saving tips with our free twice-daily newsletter
Don't miss the latest investment and personal finances news, market analysis, plus money-saving tips with our free twice-daily newsletter
In fact, a little over three weeks ago, the Dow was trading at 10,400 and by the close yesterday, it had rallied by 1,850 pips, or 18%. What a reversal of sentiment in such a short time!
But I was not on board, sadly. There were one or two places along this rally where I made nervous trades, but I was quick to take profits, and frankly, that was because I had no faith in it.
How much further will the rally run?
My long-term view remains that we are in a bear market, and this rally is a bear market rally. I had identified the 4 October low as a major low and expected a rally off this level, but I was certainly unprepared for the magnitude of it. And I don't think I was alone in this.
Since I prefer to trade with the main trend, and counter-trend trades are riskier, I was following my trading plan and waiting for the rally to top out before entering short sales.
The big question this morning is has the rally top been put in?
Trader Tip: If we are in the early stages of a very large bear market, the nearest parallel would be the 1929-1932 period the famous Stock Market Crash which accompanied the Great Depression. Take a look at the stock chart of that period and note the very vigorous bear market rallies on the way down. It is a sobering and educational task!
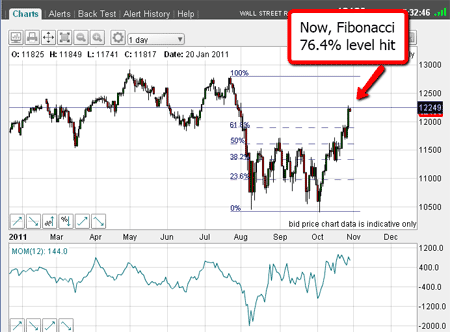
Here is the daily chart as of this morning:

The Fibonacci 62% level was sliced through and the market made it to the 76% retrace at 12,250. And stopped there.
I have noted that many of the bear market rallies over the past four years have reached 76% retraces and then turned around.
Why not go over your Dow charts and confirm this for yourself?
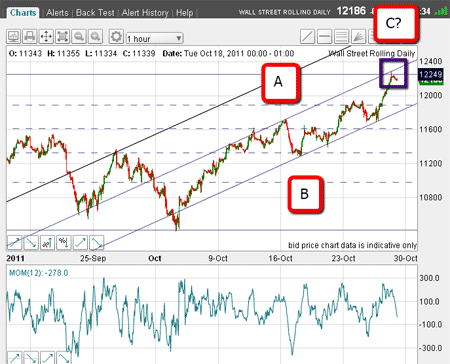
OK, I have a candidate for the final rally high now. To examine this proposition, let's take a closer view. Here is the hourly chart from the 4 October low, showing the entire 1850 pip rally:

I have drawn in my A-B-C labels as before, and now I can draw tramlines.
If you would like to see how I use my tramline trading method, view my video tutorials here.
The central tramline is pretty good with several good touch-points. I can draw my lower parallel tramline, which also has a few good touch-points. The upper tramline (which I hope will not be operative!), passes through the important high to the left of the chart.
Late yesterday, the market rallied right to the central tramline which was where it met the Fibonacci 76% level (marked by the purple box). That was a very nice place to meet!
So, there is resistance at both the tramline and the Fibonacci 76% level. That combination should be a very strong one.
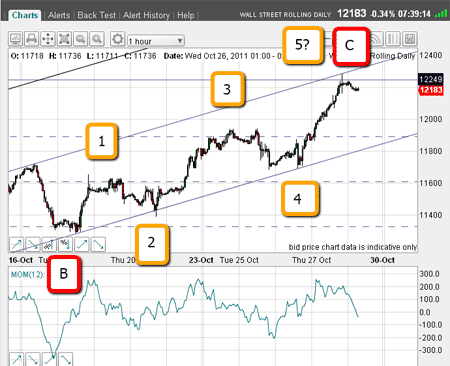
Now let's zoom in on the wave C from the Wave B low:

Wave C clearly has a five wave structure, which I have marked. In fact, it is almost textbook. We know that fifth waves are ending waves, and markets reverse from them especially from a C wave.
So, is there a strong case to suggest that the top is already in, or not?
But how can I trade this?
How I'll trade the pull back
With the evidence above, I will be shorting here and using my 3% rule for protection (I am preparing a new video tutorial on this rule which will be available soon).
If I was a more conservative trader, I would want to wait for the potential tramline break at the 11,900 area about 300 pips lower than the current market.
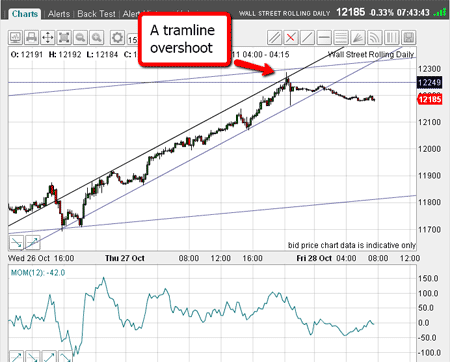
And here is an even tighter close-up of recent action:

It shows the 15-min chart of yesterday's big rally and I have drawn pretty convincing tramlines. Last night's pop above the upper tramline, where it ran into the Fibonacci 76% level and the main tramline was quickly reversed.
I have found that after an extended run, a tramline overshoot, which is quickly reversed, indicates a trend exhaustion.
I shall now be looking for a decent dip, then a rally, but not to new highs.
Many traders will be looking to short if this rally occurs.
This has been a momentous week, especially in the eurozone, and now the markets will be digesting the ramifications. Their initial reactions have been super-bullish. The question is will this stance be maintained?
If you're a new reader, or need a reminder about some of the methods I refer to in my trades, then do have a look at my introductory videos:
The essentials of tramline trading
An introduction to Elliott wave theory
Don't miss my next trading insight. To receive all my spread betting blog posts by email, as soon as I've written them, just sign up here .
Get the latest financial news, insights and expert analysis from our award-winning MoneyWeek team, to help you understand what really matters when it comes to your finances.
John is is a British-born lapsed PhD physicist, who previously worked for Nasa on the Mars exploration team. He is a former commodity trading advisor with the US Commodities Futures Trading Commission, and worked in a boutique futures house in California in the 1980s.
He was a partner in one of the first futures newsletter advisory services, based in Washington DC, specialising in pork bellies and currencies. John is primarily a chart-reading trader, having cut his trading teeth in the days before PCs.
As well as his work in the financial world, he has launched, run and sold several 'real' businesses producing 'real' products.
-
 Should you buy an active ETF?
ETFs are often mischaracterised as passive products, but they can be a convenient way to add active management to your portfolio
-
 Power up your pension before 5 April – easy ways to save before the tax year end
With the end of the tax year looming, pension savers currently have a window to review and maximise what’s going into their retirement funds – we look at how