I have another great euro trade working
John C Burford explains why, when it comes to trading the euro, Fibonacci really is your best friend.
Get the latest financial news, insights and expert analysis from our award-winning MoneyWeek team, to help you understand what really matters when it comes to your finances.
You are now subscribed
Your newsletter sign-up was successful
Want to add more newsletters?

Twice daily
MoneyWeek
Get the latest financial news, insights and expert analysis from our award-winning MoneyWeek team, to help you understand what really matters when it comes to your finances.

Four times a week
Look After My Bills
Sign up to our free money-saving newsletter, filled with the latest news and expert advice to help you find the best tips and deals for managing your bills. Start saving today!
I last covered the euro on 18 March after I had set a small test for anyone who is interested in making money using the tramline trading methods.
To recap, this was the chart I posted the previous Wednesday:
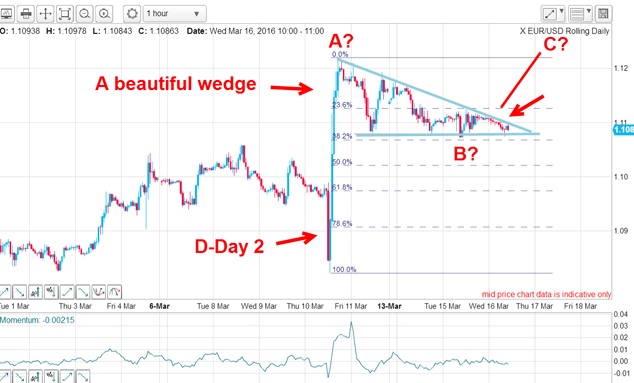
I asked what the likely path of least resistance was out of the wedge in other words, was there a trade there?
MoneyWeek
Subscribe to MoneyWeek today and get your first six magazine issues absolutely FREE

Sign up to Money Morning
Don't miss the latest investment and personal finances news, market analysis, plus money-saving tips with our free twice-daily newsletter
Don't miss the latest investment and personal finances news, market analysis, plus money-saving tips with our free twice-daily newsletter
By Friday, we had the answer it was up, confirming the C wave labels that were only a possibility on the Wednesday.
And this was the result a sharp rally in EUR/USD, which confounded many traders, because the Fed made a U-turn on rate rises and turned soft:
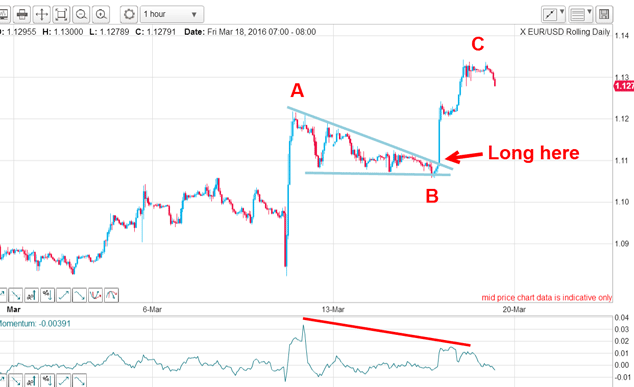
It is all very well guessing the direction correctly, but what a swing trader wants to know is how far a rally will likely carry following a great entry. That will provide a target where profits can be taken, of course.
And this is what I wrote: "But also, wave C is a Fibonacci 62% multiple of wave A at the 1.1310 area and this is a very common wave relationship."
By measuring the height of the A wave off its spiky low to its equally spiky high, I had my target for the extent of the rally and that was just above the 1.13 level. Isn't that a very simple and pretty method? Little guesswork is involved and you can set your exit orders up ahead of time. It has the added advantage of needing only a calculator, not fancy and expensive software.
To confirm that rally was a high, the market declined immediately.
So that sets up another small test and a most beautiful example of how precise Fibonacci levels can be, and why Fibonacci is a trader's best friend.
This is the hourly chart I captured at 3.30pm last Wednesday. It shows my A-B-C and the decline off the C wave high. Do you notice anything striking about this decline? It bears an uncanny similarity to the form of the B wave, doesn't it? It has the same stair-step succession of overlapping mini-waves down, which is characteristic of a corrective move.
And because the B wave was a corrective wave to the one larger trend, which was up, odds favour a similar result if the market can punch up above the blue trendline.
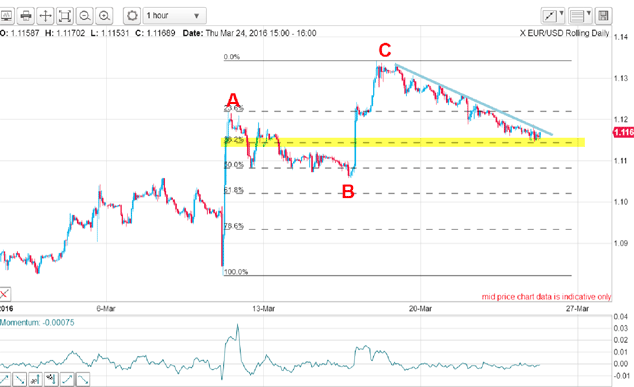
But what is the likely turning level for this current dip? This is where use of the Fibonacci method shines.
Here is the chart updated to Monday:
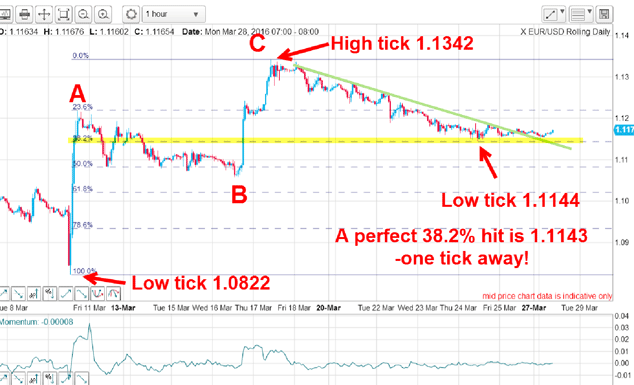
Measuring the height from the spike 1.822 low to the C wave high at 1.1342, I have a rise of 0.0246 cents.
Applying an accurate Fibonacci 38.2% retrace to this figure, I get a target at 1.1143 which is an amazing one tick away from the actual recorded 1.1144.
To me, that is a perfect hit and a beautiful validation of the Fibonacci method.
Of course, I evaluated this target long before the market had hit it, which allowed me to place a resting buy order at that level. In practice, I like to give it ten pips or so inside the target to allow for a possible slight under-hit. I don't want to miss a potential good trade, because I was too stingy on the target.
Of course, there is no guarantee that this will be a major winner (much depends on how I handle the trade). What it does offer is a low-risk possibility, because I could set my protective stop only 20 pips beneath. And in the hyperactive currency markets, that is wafer-thin.
And with a grateful nod to Yellen's uber-dovish comments yesterday, EUR/USD shot up with this result:
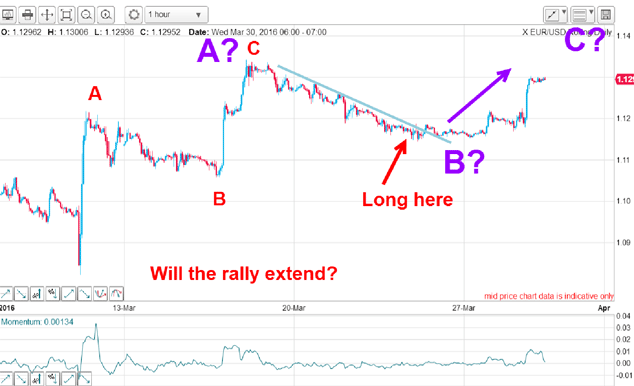
Yesterday's rally surely shocked many traders who were expecting the dollar to remain strong. Just as in the red A and C waves, much of the buying was by dollar-long traders caught in a short squeeze.
These long-dollar traders evidently take the confusing Fed utterances at face value a very dangerous game.
So now the picture has changed somewhat. The strong rally is testing the old high and if it can punch above it, it would set up the larger purple A-B-C labels.
Now I have a long trade working, I have a tough decision to make when to take profits. There is an old market saying that getting into a trade is relatively easy it is in the getting out that is difficult.
Get the latest financial news, insights and expert analysis from our award-winning MoneyWeek team, to help you understand what really matters when it comes to your finances.
John is is a British-born lapsed PhD physicist, who previously worked for Nasa on the Mars exploration team. He is a former commodity trading advisor with the US Commodities Futures Trading Commission, and worked in a boutique futures house in California in the 1980s.
He was a partner in one of the first futures newsletter advisory services, based in Washington DC, specialising in pork bellies and currencies. John is primarily a chart-reading trader, having cut his trading teeth in the days before PCs.
As well as his work in the financial world, he has launched, run and sold several 'real' businesses producing 'real' products.
-
 ISA fund and trust picks for every type of investor – which could work for you?
Whether you’re an ISA investor seeking reliable returns, looking to add a bit more risk to your portfolio or are new to investing, MoneyWeek asked the experts for funds and investment trusts you could consider in 2026
-
 The most popular fund sectors of 2025 as investor outflows continue
It was another difficult year for fund inflows but there are signs that investors are returning to the financial markets