How to profit from a spiky market
Knowing when a market will likely turn is like holding the key to a vault containing trading riches, says John C Burford.
Get the latest financial news, insights and expert analysis from our award-winning MoneyWeek team, to help you understand what really matters when it comes to your finances.
You are now subscribed
Your newsletter sign-up was successful
Want to add more newsletters?

Twice daily
MoneyWeek
Get the latest financial news, insights and expert analysis from our award-winning MoneyWeek team, to help you understand what really matters when it comes to your finances.

Four times a week
Look After My Bills
Sign up to our free money-saving newsletter, filled with the latest news and expert advice to help you find the best tips and deals for managing your bills. Start saving today!
Today I want to follow up the my coverage of GBP/USD from my 9 September post, because it will illustrate how you can make pretty accurate forecasts based on the simple principles of my tramline trading method. Knowledge of that method can help you plan good trade entries in advance.
In that post, I predicted that the rally going on at the time was likely a prelude to a tramline kiss. Now a tramline (or trendline) kiss is a very important event in my book and one of my favourite trade setups. Remember, my tramlines are always lines of support (lower tramline) and resistance (upper tramline). And when broken, they reverse roles.
Knowing when a market is likely to turn is like holding the key to a vault containing trading riches. If you can roughly pinpoint these turns, you are able to enter trade orders in advance that take advantage of this knowledge. And this kiss is one of the most reliable signposts for turns.
MoneyWeek
Subscribe to MoneyWeek today and get your first six magazine issues absolutely FREE

Sign up to Money Morning
Don't miss the latest investment and personal finances news, market analysis, plus money-saving tips with our free twice-daily newsletter
Don't miss the latest investment and personal finances news, market analysis, plus money-saving tips with our free twice-daily newsletter
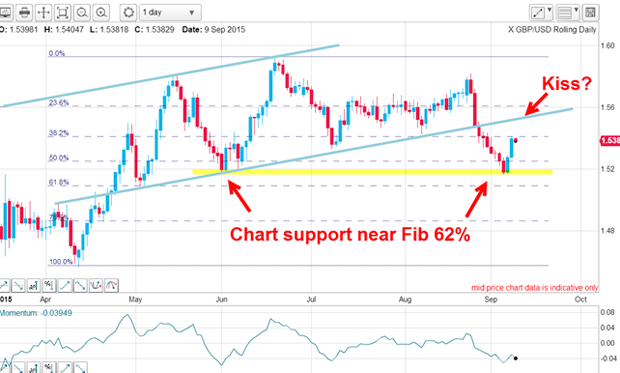
Below is the daily chart I showed back on 9 September. The blue lines are my major tramlines, and the lower line was emphatically broken on 20 August. That one event turned that tramline from a line of support into one of resistance. Previously, every attempt to break below this line was refused and the market bounced up. From late April, there were at least five such attempts and every time, the line held.

When you see a line holding after more than three attempts at breaking it, then you can put a lot of confidence that the line will continue to hold until it doesn't. If a breakdown does happen, it can be traded with high confidence.
The market dipped to the Fibonacci 62% support level with a slight overshoot. And that brings up a very important point with this market. Some markets are notorious for overshooting established support and resistance levels, particularly the normal Fibonacci levels. By the same token, other markets are not nearly so prone to this.
Cable is one of the most erratic markets going
As it happens, GBP/USD is one of the worst culprits, as you can establish from a study of the charts of all time scales. That is what makes cable a very tricky customer to trade with any precision and allowances must be made if trading it. For instance, wider than normal protective stops could be employed to give you a chance at staying with a promising trade.
Cable hit a snag, but it's still going down

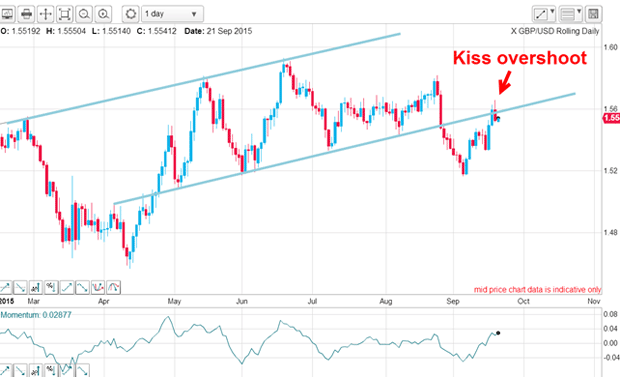
It not only made it back to the lower tramline, but it overshot the kiss!
In fact, on two successive days the market traced out pigtails, and the body of the candles hardly penetrated above the tramline. Friday's key reversal (higher high and lower close) was a clue that the kiss may well hold.

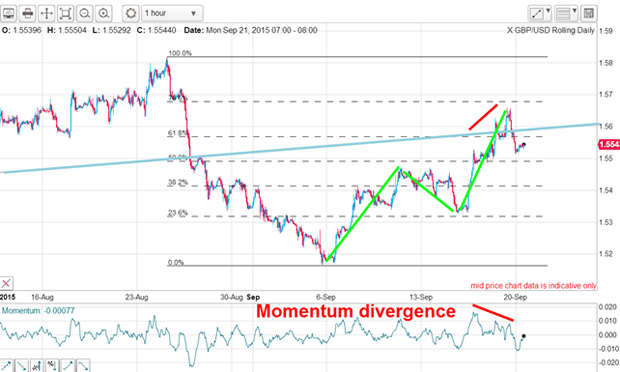
A closer look at the hourly chart shows the rally is in a clear A-B-C, suggesting it is counter-trend and there is currently a large momentum divergence, indicating a weakening of buying power. That suggests that my kiss will likely hold.
But if you have shorted the market near the blue tramline, the overshoot of 50 100 points (depending on where you placed the tramline) could have you stopped out if your stop was a 'normal' one.
That little example would tell you that if you are trading in this manner, you had better use a wider stop or be prepared to get back in if stopped out on the first attempt. Naturally, that latter option is only available if you are able to monitor the markets on a regular basis throughout the day.
On Friday, the market spiked and then came down hard back below the blue tramline and created a key reversal. That was a good indication that the kiss was very likely in and the path of least resistance now is down.
Get the latest financial news, insights and expert analysis from our award-winning MoneyWeek team, to help you understand what really matters when it comes to your finances.
John is is a British-born lapsed PhD physicist, who previously worked for Nasa on the Mars exploration team. He is a former commodity trading advisor with the US Commodities Futures Trading Commission, and worked in a boutique futures house in California in the 1980s.
He was a partner in one of the first futures newsletter advisory services, based in Washington DC, specialising in pork bellies and currencies. John is primarily a chart-reading trader, having cut his trading teeth in the days before PCs.
As well as his work in the financial world, he has launched, run and sold several 'real' businesses producing 'real' products.
-
 Average UK house price reaches £300,000 for first time, Halifax says
While the average house price has topped £300k, regional disparities still remain, Halifax finds.
-
 Barings Emerging Europe trust bounces back from Russia woes
Barings Emerging Europe trust has added the Middle East and Africa to its mandate, delivering a strong recovery, says Max King