Sterling’s on the way down – but the road won’t be straight
Chart-following traders only need to monitor the Elliott waves and Fibonacci levels to stay one step ahead, says John C Burford.
Get the latest financial news, insights and expert analysis from our award-winning MoneyWeek team, to help you understand what really matters when it comes to your finances.
You are now subscribed
Your newsletter sign-up was successful
Want to add more newsletters?

Twice daily
MoneyWeek
Get the latest financial news, insights and expert analysis from our award-winning MoneyWeek team, to help you understand what really matters when it comes to your finances.

Four times a week
Look After My Bills
Sign up to our free money-saving newsletter, filled with the latest news and expert advice to help you find the best tips and deals for managing your bills. Start saving today!
Sterling has taken a pounding of late, moving from a high of 1.58 on 25 August to a recent low of 1.5160 last week a considerable drop of over six cents in less than two weeks. This unrelenting decline has occurred in the face of generally positive sentiment towards the UK economy, which has reported decent GDP growth combined with low unemployment levels.
So, why the sharp decline in the pound versus the dollar, otherwise known as 'cable'? This break must have surprised a lot of analysts who believe it is the news and fundamentals that drive markets. But I am sure they can come up with some plausible rationalisation for it in hindsight, of course. But looking back doesn't accumulate profits, so it is a fruitless exercise.
I can offer a different explanation for the decline in GBP and it lies in the Elliott waves and Fibonacci levels that direct the size of the waves. In fact, GBP/USD offers a textbook case study in how to use basic Elliott wave theory and Fibonacci levels to forecast likely outcomes something which very few news-followers can do.
MoneyWeek
Subscribe to MoneyWeek today and get your first six magazine issues absolutely FREE

Sign up to Money Morning
Don't miss the latest investment and personal finances news, market analysis, plus money-saving tips with our free twice-daily newsletter
Don't miss the latest investment and personal finances news, market analysis, plus money-saving tips with our free twice-daily newsletter
A £27,000 trade on sterling
But note that the decline occurred in five clear waves and at the low, there appeared a stunningly large-momentum divergence:
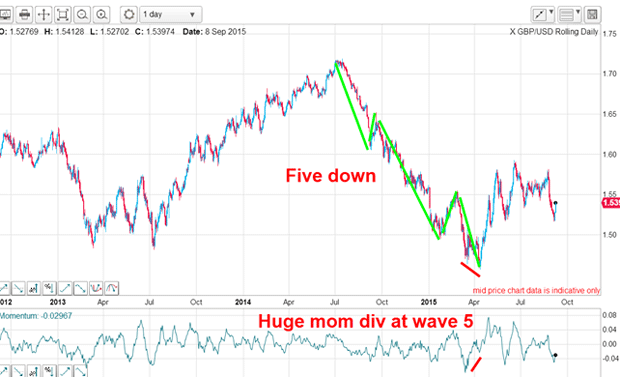
My rule, when such a large divergence is presented, is to expect a very sharp counter-trend move that should take the market back by a Fibonacci 50%, or even 62%. These are worth trading from the long side.
And because I had a completed five down in April, I know what to expect a very rapid and sharp three up and that is precisely what occurred. That much was written in that chart in April. But how high could the resulting A-B-C rally carry? For that, I needed my trusty Fibonacci tool.
The market rallied hard out of the gate and quickly climbed to the first rally high, dipped and then surged to complete my A wave, which fell shy of the Fibonacci 50% level. But because I was expecting three up, I believed the wave down would be my B wave and that was traced out (also in three sub-waves, as marked):
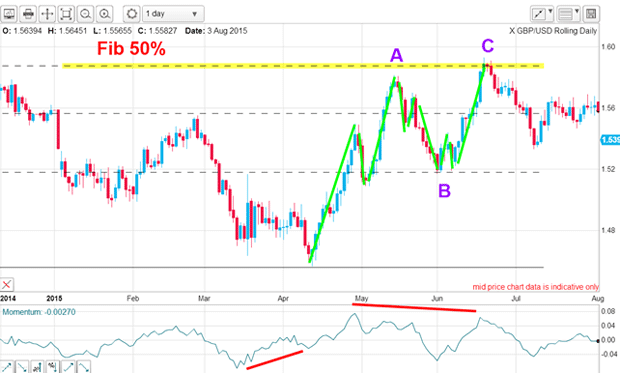
Finally, the market gave me my C wave rally to a precise hit on the Fibonacci 50% level (also in three sub-waves) to confirm my analysis. Then the market turned back down. Remember, the Fibonacci 50% and 62% levels are the most common retracements after a strong five wave move.
To recap: all I did was to note the clear five down to April and then the momentum divergence at the low. I then applied the Elliott wave rule that states that after a five down comes a three up. It is what I call the five/three rule. I forecast this rally in early April and it lasted about ten weeks plenty of time to plan my next move. And I did not require any input from the news.
I got the textbook decline I expected
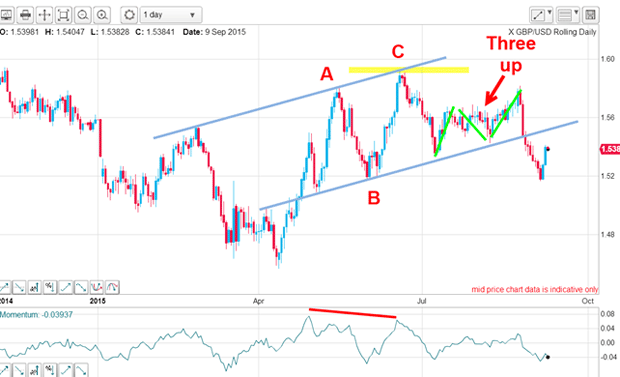
Yes, it did and then I could draw a nice tramline pair as the market rallied off my lower tramline in July and August and right into the Fibonacci 78% level:
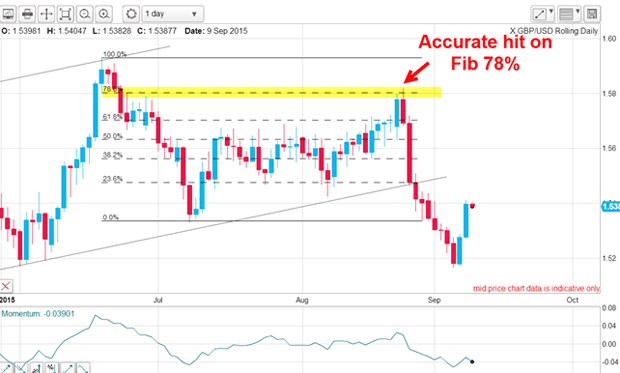
The 78% resistance level is a deep retracement and is commonly found at major turns. Knowing that the market had completed the previous A-B-C relief rally, and was very likely in a downtrend, any further rally attempt was an opportunity to position short. That accurate hit offered a classic short trade and at very low risk.
The market confirmed the downtrend by moving down hard off that top and within three days had broken the lower tramline. This morning, the market has rallied off Friday's low, but was there any way of estimating where this turn-around would occur?
Cable rallied at an important level of support
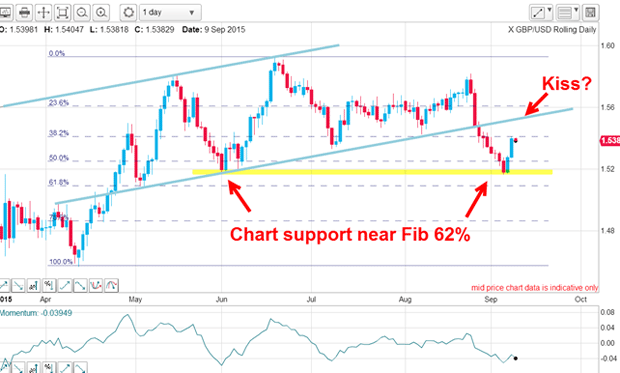
All along, there have been several excellent low-risk trades available simply by following the simple tramline methods.
But in terms of the long-range outlook, the five down/three up pattern points to an eventual resumption of the major downtrend, but as we have seen, sharp rallies are to be expected. It won't be straight down but by monitoring the Elliott waves and Fibonacci levels, you can keep one step ahead of the markets.
Get the latest financial news, insights and expert analysis from our award-winning MoneyWeek team, to help you understand what really matters when it comes to your finances.
John is is a British-born lapsed PhD physicist, who previously worked for Nasa on the Mars exploration team. He is a former commodity trading advisor with the US Commodities Futures Trading Commission, and worked in a boutique futures house in California in the 1980s.
He was a partner in one of the first futures newsletter advisory services, based in Washington DC, specialising in pork bellies and currencies. John is primarily a chart-reading trader, having cut his trading teeth in the days before PCs.
As well as his work in the financial world, he has launched, run and sold several 'real' businesses producing 'real' products.
-
 Adventures in Saudi Arabia
Travel The kingdom of Saudi Arabia in the Middle East is rich in undiscovered natural beauty. Get there before everybody else does, says Merryn Somerset Webb
-
 ISA fund and trust picks for every type of investor – which could work for you?
Whether you’re an ISA investor seeking reliable returns, looking to add a bit more risk to your portfolio or are new to investing, MoneyWeek asked the experts for funds and investment trusts you could consider in 2026