Has the Dow Jones finally turned?
Is the Dow bull market about to come to a grinding halt? John C Burford applies Elliott wave theory to the charts to find out.
Get the latest financial news, insights and expert analysis from our award-winning MoneyWeek team, to help you understand what really matters when it comes to your finances.
You are now subscribed
Your newsletter sign-up was successful
Want to add more newsletters?

Twice daily
MoneyWeek
Get the latest financial news, insights and expert analysis from our award-winning MoneyWeek team, to help you understand what really matters when it comes to your finances.

Four times a week
Look After My Bills
Sign up to our free money-saving newsletter, filled with the latest news and expert advice to help you find the best tips and deals for managing your bills. Start saving today!
In recent MoneyWeek Traders, I have been following the rallying stock markets with a view to finding a top. I've used Elliott wave theory to track the progress of the bull market and I am waiting for a particular five-wave pattern to complete.
This is the Dow on the daily chart from the November 2012 low:
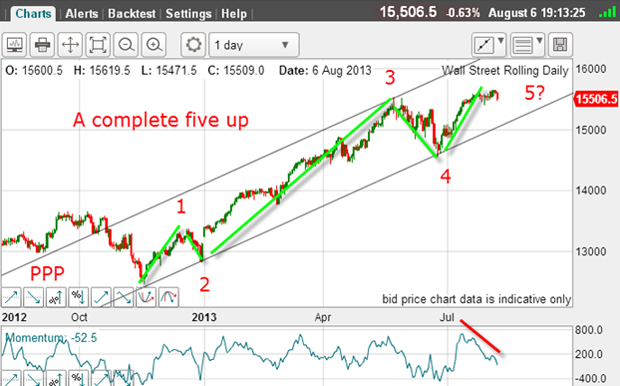
There is a textbook five waves up with wave 3 being long and strong, as is typical.
MoneyWeek
Subscribe to MoneyWeek today and get your first six magazine issues absolutely FREE

Sign up to Money Morning
Don't miss the latest investment and personal finances news, market analysis, plus money-saving tips with our free twice-daily newsletter
Don't miss the latest investment and personal finances news, market analysis, plus money-saving tips with our free twice-daily newsletter
Also note the weakening momentum as the recent new highs were made. This is a crucial piece of evidence that this latest fifth wave is running out of steam, and a turn is likely near at hand.
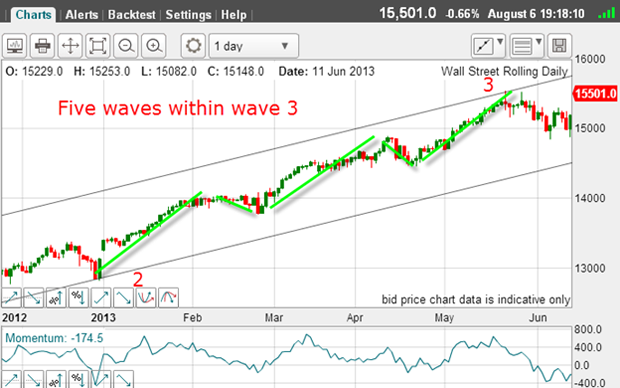
And third waves on the daily usually contain five sub-waves within and this one sure does:
And wave 4 is a classic A-B-C counter-trend pattern:
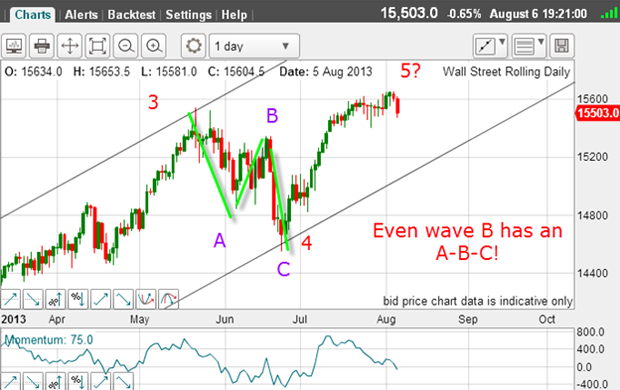
And within the B wave, there is a small A-B-C.
Remember, A-B-C patterns are counter-trend to the one larger trend. They help identify what the main trend is they are the canary in the mine.
That final fifth wave
But if this wave obeys all of the Elliott wave rules, then I can count it complete and a turn is on the cards.
In other words, I will have a high-probability top only when this final fifth wave also contains a final sub-fifth wave.
So let's now zoom in on this purported fifth wave:
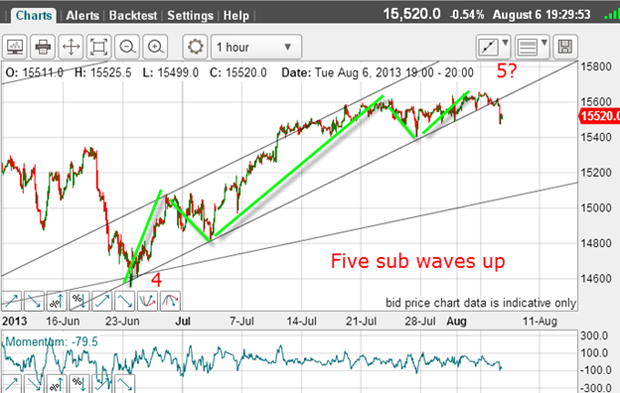
So within this final fifth wave, I can count five clear sub waves.
The third sub-wave is long and strong and has a clear five-wave count within! This is good.
And the latest high has just exceeded the top of the sub-wave 3, so it satisfies the Elliott wave rules.
This now is a prime candidate for the full and final top, according to my Elliott wave analysis and the added information provided by the weakening momentum in this fifth wave.
I have also drawn in my lower tramline connecting the wave 2 and 4 lows in the above chart. This is also in accordance with Elliott wave rules, where preference is given to drawing the line between waves 2 and 4.
Have I found the Dow top?
And crucially, the market broke beneath the lower tramline yesterday.
This is the first sign that I may have found the final Dow top, because a tramline break means the market has entered into a new lower trading channel.
If this is so, then what I now need to see is a small degree five wave move down preferably on the hourly chart.
Because the break only occurred yesterday, it is too soon to expect to see five waves down, at least on the hourly chart. But let's see what progress has been made, if any on the 15-minute chart:
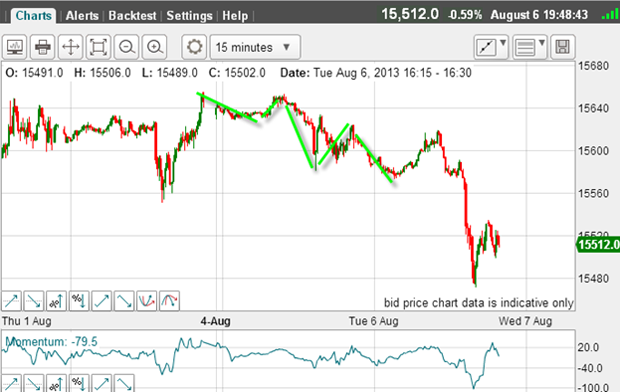
Yes, I have a clear five-wave move down (green bars) off the wave 5 high. But to really seal it, I need to see five waves down on the hourly.
I believe we are part-way there:
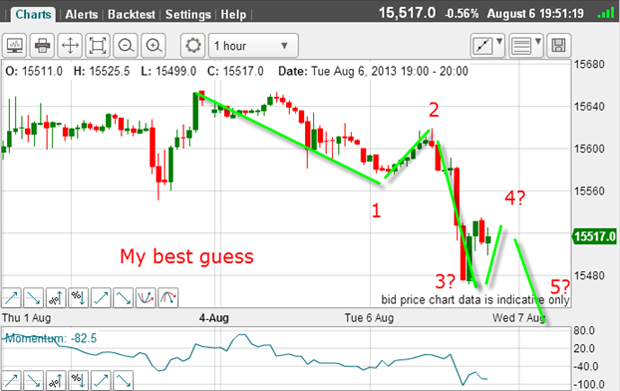
The five waves down on the 15-minute chart is my wave 1, and I have a long and strong wave 3. The market is bouncing are we in wave 4?
And if the market moves into new low ground, that will be my wave 5 and confirmation the trend is now down.
With a five-wave move down on the hourly chart, that would help increase my confidence that I had found the top and that the bear market was now underway.
Of course, after a tramline break, the market may rally back to kiss the tramline and then peel away in a scalded cat bounce.
So a rally here would not spoil the analysis, provided it remained under the wave 5 high at the 15,650 level. That is my line in the sand for my bearish view.
But if my Elliott wave labels are correct, when the market breaks, it will move very rapidly because we will be in a very large third wave down a C wave.
I hope to be describing this wave as it progresses.
Get the latest financial news, insights and expert analysis from our award-winning MoneyWeek team, to help you understand what really matters when it comes to your finances.
John is is a British-born lapsed PhD physicist, who previously worked for Nasa on the Mars exploration team. He is a former commodity trading advisor with the US Commodities Futures Trading Commission, and worked in a boutique futures house in California in the 1980s.
He was a partner in one of the first futures newsletter advisory services, based in Washington DC, specialising in pork bellies and currencies. John is primarily a chart-reading trader, having cut his trading teeth in the days before PCs.
As well as his work in the financial world, he has launched, run and sold several 'real' businesses producing 'real' products.
-
 MoneyWeek Talks: The funds to choose in 2026
Podcast Fidelity's Tom Stevenson reveals his top three funds for 2026 for your ISA or self-invested personal pension
-
 Three companies with deep economic moats to buy now
Opinion An economic moat can underpin a company's future returns. Here, Imran Sattar, portfolio manager at Edinburgh Investment Trust, selects three stocks to buy now