You can use my techniques in any type of market
The markets may vary, but the trading methods stay the same. John C Burford shows how his charting techniques can be used to profit whatever you're trading.
Get the latest financial news, insights and expert analysis from our award-winning MoneyWeek team, to help you understand what really matters when it comes to your finances.
You are now subscribed
Your newsletter sign-up was successful
Want to add more newsletters?

Twice daily
MoneyWeek
Get the latest financial news, insights and expert analysis from our award-winning MoneyWeek team, to help you understand what really matters when it comes to your finances.

Four times a week
Look After My Bills
Sign up to our free money-saving newsletter, filled with the latest news and expert advice to help you find the best tips and deals for managing your bills. Start saving today!
Currently, there are several markets that are showing some great tramlines and are providing excellent trading opportunities. Remember my trading techniques are blind' to what is being traded. The patterns stay the same!
All of these examples are being taken in real time with live charts.
US dollar / yen cross
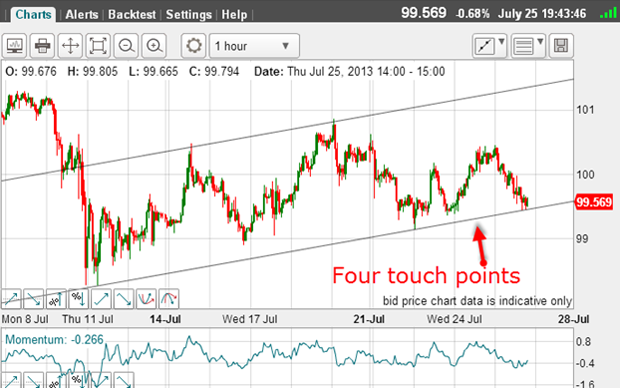
The zig-zag appearance to this rally suggests to me that it is a corrective move. The overlapping waves give the game away!
MoneyWeek
Subscribe to MoneyWeek today and get your first six magazine issues absolutely FREE

Sign up to Money Morning
Don't miss the latest investment and personal finances news, market analysis, plus money-saving tips with our free twice-daily newsletter
Don't miss the latest investment and personal finances news, market analysis, plus money-saving tips with our free twice-daily newsletter
My lower tramline, which I drew in first, has four touch points three of them exact and several near-misses, and so I consider this a solid tramline. The market is currently testing this line again.
What do I mean by solid'?
I mean that it is a reliable line of support to declines. At least four times, the market has tried to penetrate it, but has failed.
That is why it makes sense to go long when the market is at or near this lower line.
My upper tramline was easy to draw as I could take it across the two highs.
But what happens when I scroll back in time and see if there are any previous touch points? If there are, then the tramlines become even more secure.
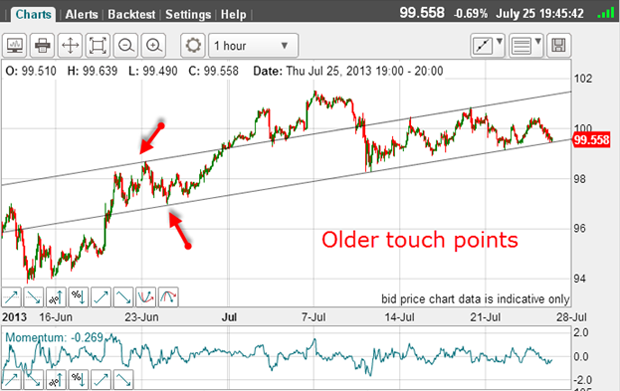
And indeed, there are several excellent older touch points back in June (red arrows).
This makes the tramline pair very reliable.
I recommend when you believe you have found a good tramline set that you scroll back in time and see where the lines hit. If they hit major highs and/or lows, you should have a solid tramline set.
But of course, tramlines do not hold for ever they eventually break down.
That is why the tramline comes in very useful for either setting protective stops, or for entering short trades.
For example, if a trader was interested in going long at the current price where it rests on the lower tramline in the 99.60 area, he could set his protective stop just beneath the most recent touch point at the 99.10 area for a 50-pip risk.
Or, if he believed the tramline will be broken, he could enter a sell order to short at the 99.10 area with protective stop just above the tramline in the 99.60 99.80 area.
Of course, he would need to have confidence that he has placed tramlines in optimum positions. Markets rarely give obvious placements they are usually not so obliging. You have to use a little artistic licence sometimes.
But here, we have tramlines that have some precise touch points.
You just have to work with what you are given, even though not every touch point will line up perfectly.
US crude oil
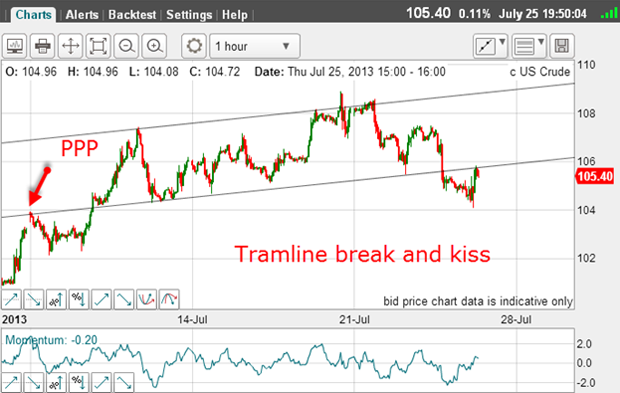
I have a solid lower tramline joining several lows and the break today below it, which is a short signal.
But note the kiss back up at the underside of this line which thereby gave a secondary sell opportunity.
Also of note is the prior pivot point (PPP) back on 7 July (red arrow). This gives the lower line added importance and makes it highly reliable.
T-bonds
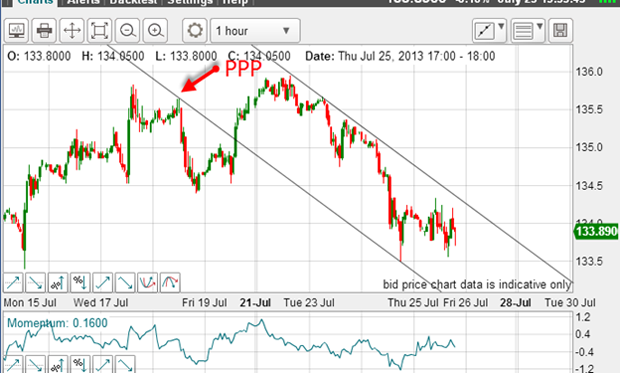
I have a nice PPP on my lower tramline, which takes it through the important 133.50 low. My upper tramline passes through the major highs of the decline off the Monday high.
Where is my lower target? On the lower tramline, of course.
And here is the bigger picture showing the up sloping tramlines where the break of the lower line was a shorting signal:
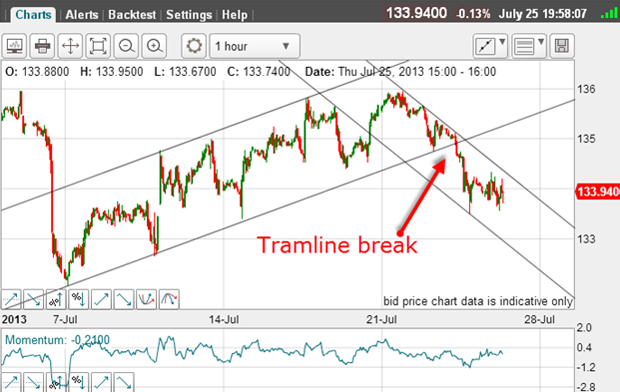
Of course, there is the possibility that the market will rally to kiss the lower tramline. That would likely set up a nice shorting opportunity.
Nikkei
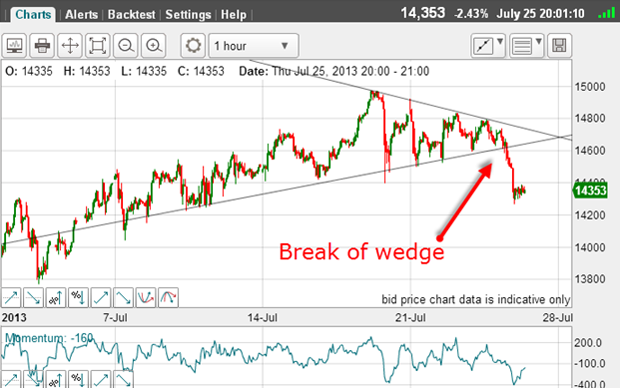
Bullish enthusiasm has been running at fever pitch and this is what the Nikkei thinks of that! It has dropped sharply through a solid trend line of the wedge pattern, which has multiple touch points.
I am unable to find a parallel tramline to this line (sometimes, there are no tramlines at work).
But the solid trend line break was a sure sell signal, particularly since it moved down from the wedge pattern. Moves out of wedges can often be sharp and strong. They are ideal for swing trading.
Now I can draw in a second down sloping tramline:
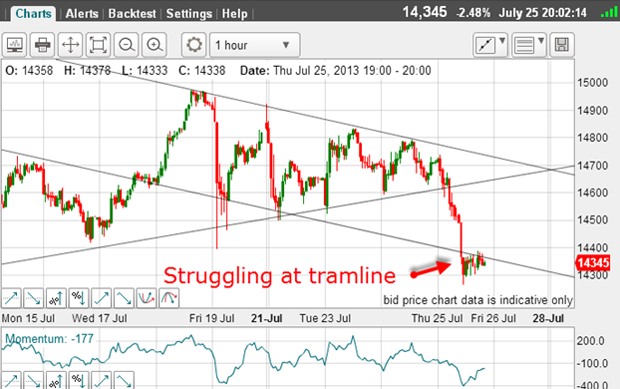
My down sloping tramlines are operating, except that I am not so confident in the lower line, as it has those large pigtails that overshoot the line.
But a continuation of the move down appears likely, since the latest commitments of traders (COT) data reveals that hedge funds (trend-followers) are now seven-to-one bullish over bearish.
As I have pointed out before, when you see this kind of imbalance, any dip will likely morph into a major decline, as sell-stops are touched like a Chinese firecracker.
Gold
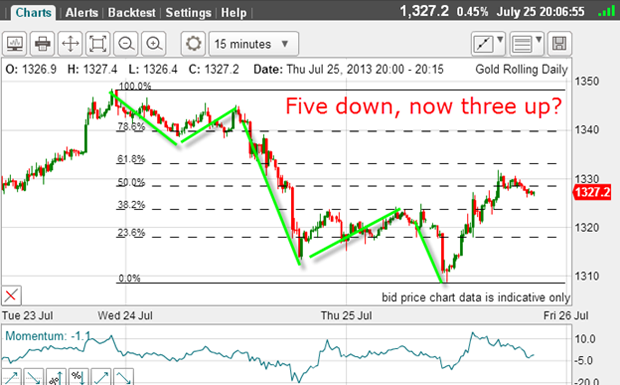
I have five clear waves down with the third wave long and strong and an A-B-C in wave 4.
There is a large positive-momentum divergence at wave 5, adding to the textbook nature of this pattern.
The rally so far has only one leg. Will it go on to make an A-B-C with the C wave topping at a higher Fibonacci level?
Get the latest financial news, insights and expert analysis from our award-winning MoneyWeek team, to help you understand what really matters when it comes to your finances.
John is is a British-born lapsed PhD physicist, who previously worked for Nasa on the Mars exploration team. He is a former commodity trading advisor with the US Commodities Futures Trading Commission, and worked in a boutique futures house in California in the 1980s.
He was a partner in one of the first futures newsletter advisory services, based in Washington DC, specialising in pork bellies and currencies. John is primarily a chart-reading trader, having cut his trading teeth in the days before PCs.
As well as his work in the financial world, he has launched, run and sold several 'real' businesses producing 'real' products.
-
 Can mining stocks deliver golden gains?
With gold and silver prices having outperformed the stock markets last year, mining stocks can be an effective, if volatile, means of gaining exposure
-
 8 ways the ‘sandwich generation’ can protect wealth
People squeezed between caring for ageing parents and adult children or younger grandchildren – known as the ‘sandwich generation’ – are at risk of neglecting their own financial planning. Here’s how to protect yourself and your loved ones’ wealth.