Gold encounters tramline resistance
Gold has run into tramline resistance since rising from its December lows, says John C Burford. Breaking through would send a bullish signal.
Get the latest financial news, insights and expert analysis from our award-winning MoneyWeek team, to help you understand what really matters when it comes to your finances.
You are now subscribed
Your newsletter sign-up was successful
Want to add more newsletters?

Twice daily
MoneyWeek
Get the latest financial news, insights and expert analysis from our award-winning MoneyWeek team, to help you understand what really matters when it comes to your finances.

Four times a week
Look After My Bills
Sign up to our free money-saving newsletter, filled with the latest news and expert advice to help you find the best tips and deals for managing your bills. Start saving today!
Now that gold has zoomed up by $200 off its $1,050 December lows, it is grabbing major headlines. Gold mining shares, which were shunned two months ago, are back in fashion. Isn't it curious how quickly sentiment can change?
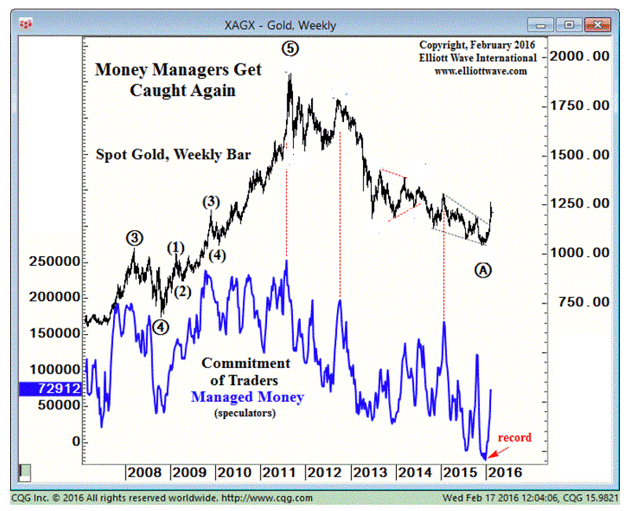
As a measure of market sentiment, I have shown charts before of the position of hedge funds in the futures market in terms of their holdings of long and short futures and options. Remember, the Comex gold futures market is the leading arena for price discovery and the hedge fund group is the major player.
I have stated many times that hedge funds are herding beasts they are primarily trend followers, not contrarians. If they spot a definite trend, they will jump on it seemingly regardless of the dangerous waters that lie ahead.
MoneyWeek
Subscribe to MoneyWeek today and get your first six magazine issues absolutely FREE

Sign up to Money Morning
Don't miss the latest investment and personal finances news, market analysis, plus money-saving tips with our free twice-daily newsletter
Don't miss the latest investment and personal finances news, market analysis, plus money-saving tips with our free twice-daily newsletter
That means after a trend develops, hedge funds will, as a group, accumulate either long or short positions in the trend's direction. Then, when the trend turns, they are caught with a maximum amount of wrong-way bets. In gold, they have been adding bearish bets all the time during the downtrend last year. That is, until the trend change in December.
And individual traders, who are not herders, can use this priceless information to our advantage.
Here is the updated sentiment chart as measured by the Commitments of Traders (COT) data. Remember, this is not a survey (as is the Daily Sentiment Index that I often quote), but real money on the line. This is the ultimate commitment to express your views.

(Chart courtesy www.elliottwave.com)
The blue line represents the net position of hedge funds (managed money) with respect to their long/short futures and options holdings. In December, a most unusual event occurred they held a net short position (the record on the chart).
For speculators, this is an all-time record level of bearishness.
Just admire the coincidence of the highs in the market with the highs in the blue line. If an intelligent Martian landed and saw this chart and knew nothing about gold or trading or the futures markets, wouldn't it conclude that money can be made by shorting at the highs and buying at the lows as indicated by this COT data?
Yet most hedge fund managers are oblivious to this rather obvious relationship. Maybe they are just not as smart as many believe. In fact, that is certainly true otherwise we wouldn't have a chart, such as the above, to guide our trading.
But in the mainstream media at least, hedge fund managers are seen as very wealthy magicians who can conjure up millions for themselves in the markets.
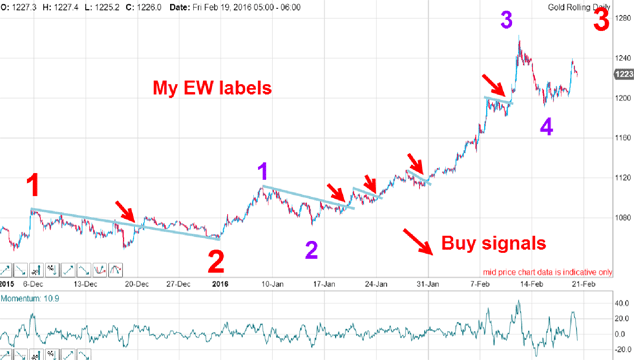
Today, I will show you my interpretation of the twists and turns of the gold market since the December lows.

My blue lines are trend lines drawn against the minor highs, and every time the market broke above them that was a clear buy signal.
My red wave 3 contains its own mini-five up and the spike high to the $1,265 high is my purple wave 3. This week's decline off it is my purple wave 4. Now, fourth waves can be very tricky affairs as I showed on Wednesday when covering the euro.
Wave 4 could morph into something more complex and even decline a little more before bottoming. But when wave 4 does terminate, a rally should take the market to the purple wave 5 high above $1,270.
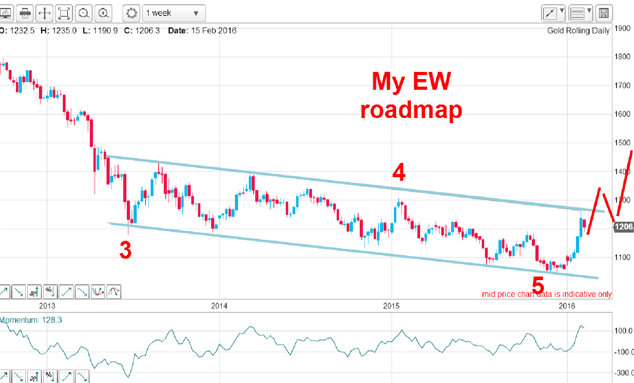
How does this fit onto the bigger picture? Here is the weekly chart going back to 2012:

The $1,050 December low was the final fifth wave down off the 2011 top, and the rally since then is part of what should be wave 1 of a five up. I have excellent tramlinesdrawn (that amends the wedge conjecture in my 10 February post) and the spike high to $1,265 has bounced off the upper tramline as it hit resistance.
If the market can break above that tramline, it will send a strong bullish signal and the masses of buy-stops placed above the highs that are arrayed along it since 2013 will be touched off with explosive effect.
But a word of caution: hedge funds are moving rapidly to the bullish camp (see first chart), so large sell-offs become much more likely. Traders beware!
Get the latest financial news, insights and expert analysis from our award-winning MoneyWeek team, to help you understand what really matters when it comes to your finances.
John is is a British-born lapsed PhD physicist, who previously worked for Nasa on the Mars exploration team. He is a former commodity trading advisor with the US Commodities Futures Trading Commission, and worked in a boutique futures house in California in the 1980s.
He was a partner in one of the first futures newsletter advisory services, based in Washington DC, specialising in pork bellies and currencies. John is primarily a chart-reading trader, having cut his trading teeth in the days before PCs.
As well as his work in the financial world, he has launched, run and sold several 'real' businesses producing 'real' products.
-
 MoneyWeek Talks: The funds to choose in 2026
Podcast Fidelity's Tom Stevenson reveals his top three funds for 2026 for your ISA or self-invested personal pension
-
 Three companies with deep economic moats to buy now
Opinion An economic moat can underpin a company's future returns. Here, Imran Sattar, portfolio manager at Edinburgh Investment Trust, selects three stocks to buy now