Gold's explosive rally stuns the bears
The gold bears were caught napping when the market turned against them. John C Burford checks the charts.
Get the latest financial news, insights and expert analysis from our award-winning MoneyWeek team, to help you understand what really matters when it comes to your finances.
You are now subscribed
Your newsletter sign-up was successful
Want to add more newsletters?

Twice daily
MoneyWeek
Get the latest financial news, insights and expert analysis from our award-winning MoneyWeek team, to help you understand what really matters when it comes to your finances.

Four times a week
Look After My Bills
Sign up to our free money-saving newsletter, filled with the latest news and expert advice to help you find the best tips and deals for managing your bills. Start saving today!
My last post on gold appeared on 7 December a full two months ago. So why the hiatus? Have I lost interest in it since then? Or maybe the market has disappointed me and veered off the bullish roadmap I have set?
Remember, I had just congratulated the bears who forecast a downside target at $1,050 and achieved it. I always show a great deal of respect to an analyst who can make a genuine forecast (it must always be in advance) that is met.
Back then, I had taken all profits on bearish positions well before that $1,050 level was met and was looking for a major trend change. My wave analysis convinced me that once that downtrend had completed, a vigorous rally phase would ensue and I was not about to miss out. The profit potential was just too tempting.
MoneyWeek
Subscribe to MoneyWeek today and get your first six magazine issues absolutely FREE

Sign up to Money Morning
Don't miss the latest investment and personal finances news, market analysis, plus money-saving tips with our free twice-daily newsletter
Don't miss the latest investment and personal finances news, market analysis, plus money-saving tips with our free twice-daily newsletter
But I knew that the $1,050 level was highly significant it is the Fibonacci 50% retrace of the bull run off the 2002 "Brown low" to the 2011 all-time high of $1,920. If the bear trend was going to end, and if I had my wave count correct, that would be the ideal place to make the turn.
Back then in December, gold was barely on the radar of most, but what a difference a month can make! Now the metal is grabbing the headlines after its stunning rally phase.
In fact, in the past two months, the market has been following my roadmap to a tee.
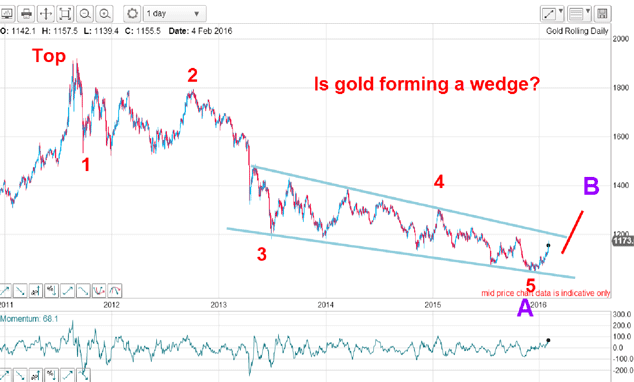
Here is the long-term chart showing my wave count:

This is certainly not a conventional Elliott wave picture.Waves 2 and 4 are highly complex and a nightmare to trade. But now, the fog is clearing and I can allocate the above labels with some confidence.
The red wave 5 ended at the $1,050 level in December, and that was also the end of the much larger purple A wave off the 2011 top.
We are now in the process of forming the purple B wave up. The A wave stretched over a span of $870. If the B wave to come is not to peter out with a wimp, then the outlook is for a rally phase of hundreds of dollars.
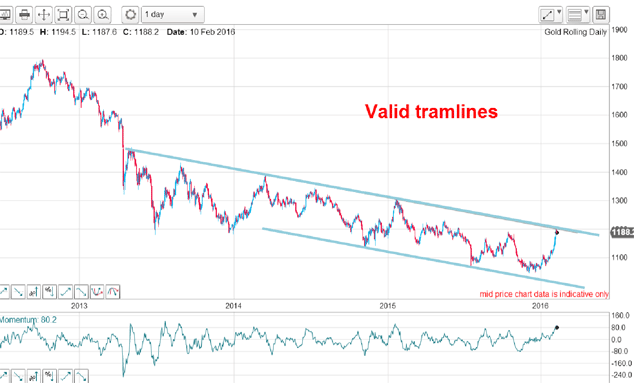
I also have a potential wedge forming with the upper wedge line sporting several accurate touch points. But there are other lines of support and resistance I can draw in waves 4 and 5. Here is a valid alternative tramline pair:

The upper tramline has at least three accurate touch points, and currently the market has risen up to it again. My lower tramline incorporates two accurate touch points.
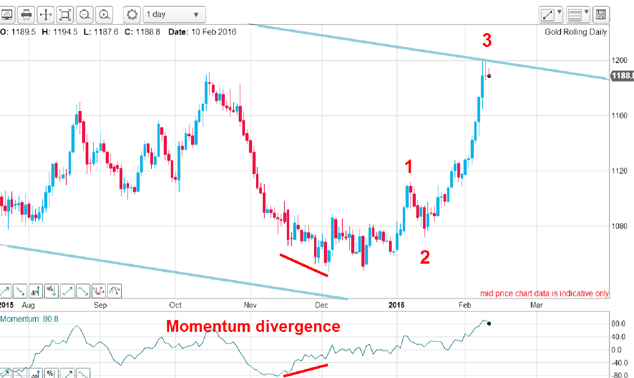
With this $150 rally off the December lows, how are my Elliott waves shaping up?
This is a close-up of recent action:

There are a few interesting points here. First, the market failed to hit the lower tramline in December and started edging up. That failure is usually a sign the impending rally will be sharp, and especially so given the momentum divergence. Recall, whenever the price makes a new low following an established downtrend and the momentum fails to follow, it usually means that the selling pressure is waning.
And that clue gave me the precisely correct outcome. After waves 1 and 2 were in place, the market simply rocketed up in an exponential explosive rally in a typical third wave. Remember, third waves are usually long and strong as this one amply demonstrates.
But now the market is at a crossroads. It has hit the upper tramline resistance at its recent high of $1,200, the momentum is over-bought and traders are no longer massively bearish.
As proof of the latter, here is the latest Commitments of traders (COT) report as of 2 February:
| (Contracts of 100 troy ounces) | Row 0 - Cell 1 | Row 0 - Cell 2 | Row 0 - Cell 3 | Open interest: 537,133 | ||||
| Commitments | ||||||||
| 184,321 | 100,456 | 130,475 | 179,237 | 267,946 | 494,033 | 498,878 | 43,100 | 38,255 |
| Changes from 01/26/16 (Change in open interest: 6,860) | ||||||||
| 5,811 | -9,321 | -7,882 | 7,185 | 26,264 | 5,114 | 9,060 | 1,746 | -2,200 |
| Percent of open in terest for each category of traders | ||||||||
| 34.3 | 18.7 | 24.3 | 33.4 | 49.9 | 92.0 | 92.9 | 8.0 | 7.1 |
| Number of traders in each category (Total traders: 351) | ||||||||
| 164 | 110 | 117 | 57 | 64 | 264 | 251 | Row 8 - Cell 7 | Row 8 - Cell 8 |
This is a snapshot taken just after the market had moved above my wave 2 high around the $1,120 area. Already, speculators were moving out of short positions and into long ones, as is expected during a bull phase. But that was $80 ago. Naturally, the next data report on Friday will show a lot more movement into bullish bets.
In the short term, odds now favour a pull-back in wave 4. But if the market catches another bid, the $1,200 resistance level will be breached and my upper tramline would be broken with highly bullish implications.
Tomorrow, the Federal Reserve chair Janet Yellen will appear before the US Senate, and what she says could well have major ramifications for many markets including gold. She is under great pressure to delay the interest rate rise she "promised" for March.
There is a lot riding on what she says (or doesn't say).
Get the latest financial news, insights and expert analysis from our award-winning MoneyWeek team, to help you understand what really matters when it comes to your finances.
John is is a British-born lapsed PhD physicist, who previously worked for Nasa on the Mars exploration team. He is a former commodity trading advisor with the US Commodities Futures Trading Commission, and worked in a boutique futures house in California in the 1980s.
He was a partner in one of the first futures newsletter advisory services, based in Washington DC, specialising in pork bellies and currencies. John is primarily a chart-reading trader, having cut his trading teeth in the days before PCs.
As well as his work in the financial world, he has launched, run and sold several 'real' businesses producing 'real' products.
-
 Average UK house price reaches £300,000 for first time, Halifax says
While the average house price has topped £300k, regional disparities still remain, Halifax finds.
-
 Barings Emerging Europe trust bounces back from Russia woes
Barings Emerging Europe trust has added the Middle East and Africa to its mandate, delivering a strong recovery, says Max King