Eye-popping COT data reveals some huge swings
As mere human beings, traders are capable of dramatic about-turns in sentiment. John C Burford refers to two recent examples, and explains what they mean for the markets.
Get the latest financial news, insights and expert analysis from our award-winning MoneyWeek team, to help you understand what really matters when it comes to your finances.
You are now subscribed
Your newsletter sign-up was successful
Want to add more newsletters?

Twice daily
MoneyWeek
Get the latest financial news, insights and expert analysis from our award-winning MoneyWeek team, to help you understand what really matters when it comes to your finances.

Four times a week
Look After My Bills
Sign up to our free money-saving newsletter, filled with the latest news and expert advice to help you find the best tips and deals for managing your bills. Start saving today!
With the Fed seemingly in complete control of the financial markets (as most believe), and with all eyes upon Wednesday's release of their latest deliberations and forecasts, the latest commitments of traders (COT) data is showing some remarkablere-alignments as traders/investors position themselves for what they believe the report will say.
Last Friday, the latest COT data was released for the date of Tuesday 11 June, and some of the switching is truly amazing.
Remember, the futures positions in the US markets (the world's most influential) is an expression of a monetary commitment by all participants. To me, this is a more genuine gauge of public sentiment than even the best of the sentiment measures that poll individuals how they feel about a particular market.
MoneyWeek
Subscribe to MoneyWeek today and get your first six magazine issues absolutely FREE

Sign up to Money Morning
Don't miss the latest investment and personal finances news, market analysis, plus money-saving tips with our free twice-daily newsletter
Don't miss the latest investment and personal finances news, market analysis, plus money-saving tips with our free twice-daily newsletter
As we all know, we can feel positive in the morning and then, after a particularly lousy day, feel more negative in the afternoon! Your response to a poll is perhaps not a very accurate reflection of the true state of your attitude to that market after all, you have no money on the line, as you do when you have a futures position.
A position is a much more serious expression of your sentiment and commitment I like to say the COT is where you put your money where your mouth is.
So, let me show a couple of eyebrow-raising examples from last week.
The euro: here come the bulls
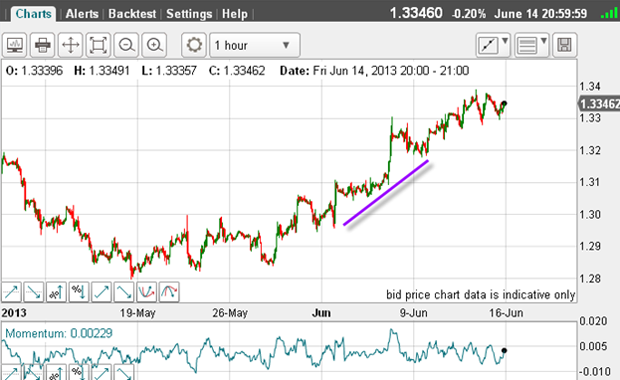
Here is the hourly chart:

And here is the COT data:
| Contracts of EUR 125,000 | Row 0 - Cell 1 | Row 0 - Cell 2 | Row 0 - Cell 3 | Open interest: 260,418 | ||||
| Commitments | ||||||||
| 68,956 | 76,489 | 14,860 | 128,701 | 106,793 | 212,517 | 198,142 | 47,901 | 62,276 |
| Changes from 06/04/13 (Change in open interest: 19,685) | ||||||||
| 25,152 | -18,936 | 7,094 | -20,266 | 28,380 | 11,980 | 16,538 | 7,705 | 3,147 |
| Percent of open in terest for each category of traders | ||||||||
| 26.5 | 29.4 | 5.7 | 49.4 | 41.0 | 81.6 | 76.1 | 18.4 | 23.9 |
| Number of traders in each category (Total traders: 167) | ||||||||
| 43 | 52 | 35 | 50 | 47 | 109 | 118 | Row 8 - Cell 7 | Row 8 - Cell 8 |
When I saw that, my jaw dropped almost to the floor! Let's admire what the specs have achieved:
The non-commercials (hedge funds) have increased their long positions by a whopping 36%, while at the same time have decreased their short positions by a huge 25%.
On 4 June, the ratio of longs to shorts was 0.46, just a week later the ratio was 0.90 an incredible doubling in only one week.
It's clear: the hedgies have had a mass conversion from being bears to bulls.
I don't know about you, but that is as close to a 180-degree turn in sentiment as is likely possible in one week.
The small specs also performed a more bullish switch, but were put in the shade by the hedgies.
With the market having continued its rally into Friday, I'm sure this switch to a more radically bullish position has continued.
In a way, this switch is not surprising although the magnitude certainly is since hedge funds are trend-followers, and the market has been trending higher since the July 2012 low and the recent 1 April low at the 1.28 level.
But my question is: Have the hedge funds seen the bullish light too late? After all, trends have a nasty habit of turning just when enough specs have been sucked in.
We have seen plenty of examples of this in my Trader posts gold topping out at $1,920 in 2011 being the highlight.
But the market has made a Fibonacci 62% retrace of the wave down off the 1 February high and the early April low. This would be an excellent place to look for a turn.
A volatile week for the S&P 500
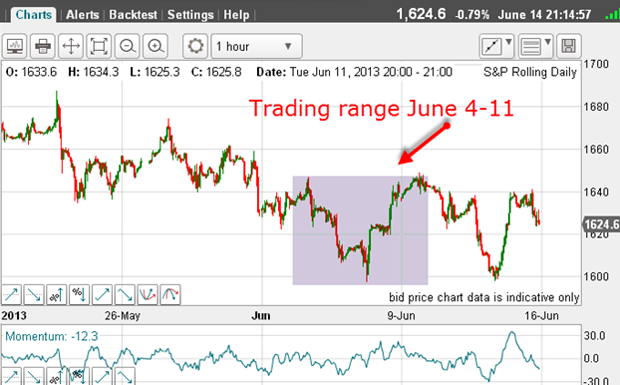
Here is the hourly chart for the week of June 4-11:

A pretty wild week with a range of around 50 big points, but the market ended up nearly unchanged on this volatile week.
Here is the COT data:
| ($50 x S&P 500 INDEX) | Row 0 - Cell 1 | Row 0 - Cell 2 | Row 0 - Cell 3 | Open interest: 3,397,407 | ||||
| Commitments | ||||||||
| 456,571 | 341,749 | 146,448 | 2,460,416 | 2,579,876 | 3,063,435 | 3,068,073 | 333,972 | 329,334 |
| Changes from 06/04/13 (Change in open interest: 89,555) | ||||||||
| -71,381 | 13,509 | 33,723 | 49,263 | 20,046 | 11,605 | 67,278 | 77,950 | 22,277 |
| Percent of open in terest for each category of traders | ||||||||
| 13.4 | 10.1 | 4.3 | 72.4 | 75.9 | 90.2 | 90.3 | 9.8 | 9.7 |
| Number of traders in each category (Total traders: 534) | ||||||||
| 109 | 98 | 63 | 220 | 234 | 366 | 362 | Row 8 - Cell 7 | Row 8 - Cell 8 |
Another eye-popper!
Here, the hedge funds have massively increased their net short position with a large 16% decrease in their long positions and a 4% increase in short positions.
But the small specs (many of whom favour day trading the e-mini), have even out-gunned the hedgies with a massive 23% increase in longs and a smaller 7% increase in shorts for a net increase in long positions.
Traditionally, the small specs are considered the weak hands who have the closest stops, whereas hedge funds are much more deeply financed and can hold adverse positions more tightly. The strongest hands are, of course, the commercials who are much less price-sensitive.
So we have an interesting situation where the hedge funds have become much more bearish, while the small specs are much more bullish with the commercials in the middle. All the while, the market went nowhere.
It is very unusual, when we get such a stark difference of opinion between the hedgies and the small specs that the small specs come out on top.
To me, the COT data is telling me that the odds are high for a continuation of the decline off the 22 May high, but as last week showed, sharp rallies are entirely possible.
We know from AAII surveys that the small investor/trader has been much more wary of getting back into equities since January than the large money managers, but now suddenly, they have woken up to the virtues of equity ownership just after a massive four-year bull market!
This is classic small investor behaviour piling into equities at tops and selling out at market bottoms. This COT data is confirming this again.
So, this is one more piece of evidence to say that the 22 May high is a major one, but of course, only time will tell if this is correct.
Also, I have found that the COT and sentiment data is not a good trade timing method all it does is indicate likely turns ahead, and in which direction. I use my other methods to time entries.
Anything is possible in markets, but not everything is probable.
Get the latest financial news, insights and expert analysis from our award-winning MoneyWeek team, to help you understand what really matters when it comes to your finances.
John is is a British-born lapsed PhD physicist, who previously worked for Nasa on the Mars exploration team. He is a former commodity trading advisor with the US Commodities Futures Trading Commission, and worked in a boutique futures house in California in the 1980s.
He was a partner in one of the first futures newsletter advisory services, based in Washington DC, specialising in pork bellies and currencies. John is primarily a chart-reading trader, having cut his trading teeth in the days before PCs.
As well as his work in the financial world, he has launched, run and sold several 'real' businesses producing 'real' products.
-
 Pension Credit: should the mixed-age couples rule be scrapped?
The mixed-age couples rule was introduced in May 2019 to reserve pension credit for older households but a charity warns it is unfair
-
 Average income tax by area: The parts of the UK paying the most tax mapped
The UK’s total income tax bill was £240.7 billion 2022/23, but the tax burden is not spread equally around the country. We look at the towns and boroughs that have the highest average income tax bill.