Euro bear market resumes
In the wake of the euro's recent decline, traders have rushed over to the long-side. Are they right to expect a rally? John C Burford turns to the charts for answers.
Get the latest financial news, insights and expert analysis from our award-winning MoneyWeek team, to help you understand what really matters when it comes to your finances.
You are now subscribed
Your newsletter sign-up was successful
Want to add more newsletters?

Twice daily
MoneyWeek
Get the latest financial news, insights and expert analysis from our award-winning MoneyWeek team, to help you understand what really matters when it comes to your finances.

Four times a week
Look After My Bills
Sign up to our free money-saving newsletter, filled with the latest news and expert advice to help you find the best tips and deals for managing your bills. Start saving today!
TABLE.ben-table TABLE {BORDER-BOTTOM: #2b1083 1px solid; BORDER-LEFT: #2b1083 1px solid; BORDER-TOP: #2b1083 1px solid; BORDER-RIGHT: #2b1083 1px solid}TH {TEXT-ALIGN: center; BORDER-LEFT: #a6a6c9 1px solid; PADDING-BOTTOM: 2px; PADDING-LEFT: 1px; PADDING-RIGHT: 1px; BACKGROUND: #2b1083; COLOR: white; FONT-SIZE: 0.8em; FONT-WEIGHT: bold; PADDING-TOP: 2px}TH.first {TEXT-ALIGN: left; BORDER-LEFT: 0px; PADDING-BOTTOM: 2px; PADDING-LEFT: 1px; PADDING-RIGHT: 1px; FONT-SIZE: 0.8em; PADDING-TOP: 2px}TR {BACKGROUND: #fff}TR.alt {BACKGROUND: #f6f5f9}TD {TEXT-ALIGN: center; BORDER-LEFT: #a6a6c9 1px solid; PADDING-BOTTOM: 2px; PADDING-LEFT: 1px; PADDING-RIGHT: 1px; COLOR: #000; FONT-SIZE: 0.8em; PADDING-TOP: 2px}TD.alt {BACKGROUND-COLOR: #f6f5f9}TD.bold {FONT-WEIGHT: bold}TH.date {FONT-SIZE: 0.7em}TD.first {TEXT-ALIGN: left}TD.left {TEXT-ALIGN: left}TD.bleft {TEXT-ALIGN: left; FONT-WEIGHT: bold}
"Greece is collapsing, the Iranians are getting aggressive, and Rome is in disarray. Welcome back to 480 BC"
That's a comment I came across in the blogosphere recently and what a succinct summary it is of the state of the eurozone and the nuclear threat!
MoneyWeek
Subscribe to MoneyWeek today and get your first six magazine issues absolutely FREE

Sign up to Money Morning
Don't miss the latest investment and personal finances news, market analysis, plus money-saving tips with our free twice-daily newsletter
Don't miss the latest investment and personal finances news, market analysis, plus money-saving tips with our free twice-daily newsletter
Sometimes, human history does repeat, or at least, rhyme.
We've been following the Dow and gold a fair bit recently as they have fallen in unison as liquidity has dried up. Today, let's catch up with how the euro's been handling the situation.
As you'll see, it's thrown up some useful lessons for you in Fibonacci retracements and more.
Here's how my latest euro trade worked out
I last covered the euro on 11 June when the market was zigging and zagging between the 1.23 and 1.26 zone, having previously slumped from the 1.32 level in early May.
The market was in a clear downtrend, but I smelled a rat. That rat was the huge gap up opening Monday 11 June, which caught the huge army of bears flat-footed (bullish sentiment was on the floor).
So my latest short trade was taken out for a small loss on that huge gap opening. And as I wrote that last issue I was deciding on my next move, asking whether the gap to the 1.2660 Monday high was enough to satisfy my long-standing 1.27 target.
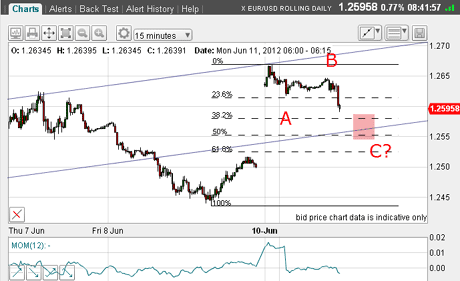
I decided that since the rally top was within a whisker of my 1.27 target, I would enter a short trade.
This was the situation then:
(Click on the chart for a larger version)
I was looking for a move down to the area of the pink bar to look to take profits and the market duly obliged.
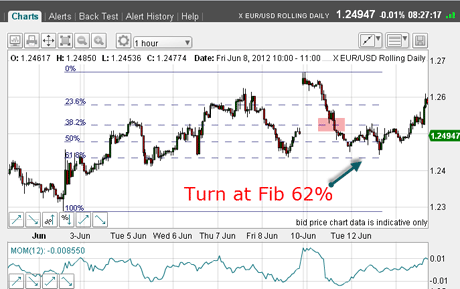
In fact, it overshot my target by a wide margin, as you can see here:
(Click on the chart for a larger version)
A great lesson in how to use Fibonacci
After that, the euro duly stopped and turned at the Fibonacci 62% retrace.
Trader tip: This is a great example of how I use Fibonacci. I had a rally in a bear market off the 12 June low, so that was my first pivot point and I had my high pivot point at Monday's high. Note how that 62% level has acted as support on several occasions. The market considers this level important, so it is best to think likewise. Of course, a break would have been bearish. (For more on Fibonannci, watch this short tutorial.)
Having taken my profit, I again considered my next move. I could see another rally was building would it carry to my 1.27 target after all... and make a new, larger A-B-C pattern?
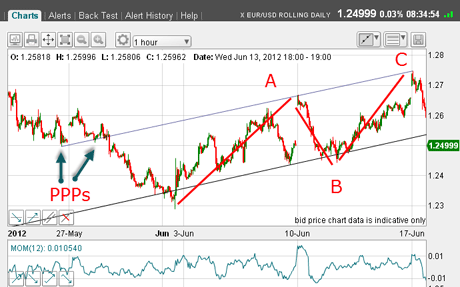
Exactly one week later, the market gapped up on the Monday. Was history about to repeat with a decline off this high?
(Click on the chart for a larger version)
At that point, I was able to draw a pair of tramlines using this latest rally top as a touch-point. Note the superb prior pivot points(PPPs) on the upper line. The lower tramline is not quite so convincing, but is acceptable.
That was the signal for me to enter another short trade.
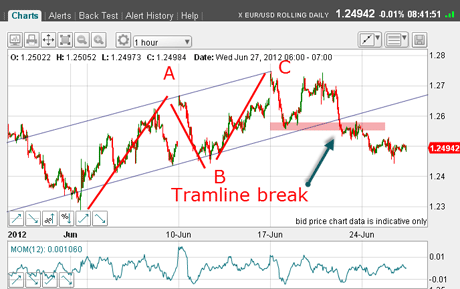
And as I write this morning, the market has broken the lower tramline, having completed that new A-B-C rally pattern:
(Click on the chart for a larger version)
Note also how the market has broken below the chart support (pink bar).
For more cautious traders, this tramline break could have been a signal to short the market, of course.
Signs that the euro's bear market is back on track
So my long-standing target at 1.27 has been hit and exceeded by about 50 pips. Now, all signs are that the bear market is back on track after that brief diversion.
So let's take a look at the latest Commitments of Traders (COT) data to try to see if there have been any significant structural changes during this 450-pip rally:
| (CONTRACTS OF EUR 125,000) OPEN INTEREST: 311,933 | ||||||||
| COMMITMENTS | ||||||||
| 54,449 | 195,515 | 1,994 | 224,084 | 47,855 | 280,527 | 245,364 | 31,406 | 66,569 |
| CHANGES FROM 05/08/12 (CHANGE IN OPEN INTEREST: 35,637) | ||||||||
| 15,204 | -38,917 | -32,208 | -92,947 | -34,744 | -109,951 | -105,869 | -247 | -4,329 |
| PERCENT OF OPEN INTEREST FOR EACH CATEGORY OF TRADERS | ||||||||
| 17.5 | 62.7 | 0.6 | 71.8 | 15.3 | 89.9 | 78.7 | 10.1 | 21.3 |
| NUMBER OF TRADERS IN EACH CATEGORY (TOTAL TRADERS: 190) | ||||||||
| 37 | 72 | 11 | 39 | 47 | 83 | 123 | Row 8 - Cell 7 | Row 8 - Cell 8 |
You can see that the large speculators (Non-Commercials) are still heavily short (195,515 short contracts versus 54,449 long).
But check out the week's changes. The large specs have reduced their short positions by almost 39,000 contracts a massive 20% reduction!
That is some short squeeze! And they have increased long positions are they picking bottoms?
Also note the Commercials (banks hedging genuine trade) have exited the market in droves both longs and shorts. Could this indicate that eurozone trade with the rest of the world is falling off a cliff?
My initial conclusion from all of this is that the market is now much more balanced and not so short-heavy, so that rallies should become less intense.
My major downside target for the euro remains the 1.20 level, matching the huge low made a year ago. I've shown that with the pink bar on this chart:
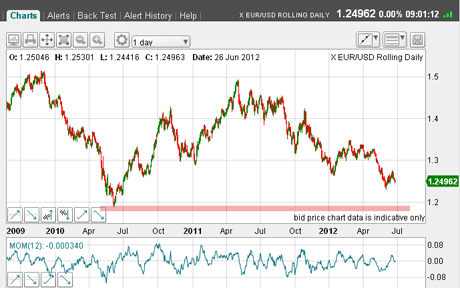
(Click on the chart for a larger version)
But just consider this
Here's what's moving the dollar higher
What we often forget in trading the EUR/USD is the outlook for the USD. What I mean is that most eyes are on the euro, at least in the media, since this is an exciting story: the death of the euro.
But what's moving money back into dollars is the deflationary wave debts denominated in dollars require cash dollars to reduce the debt mountain, which is a prime mover today.
Besides, the US dollar had been beaten down hard. Was all the bad news in the price last year?
If you're a new reader, or need a reminder about some of the methods I refer to in my trades, then do have a look at my introductory videos:
The essentials of tramline trading
An introduction to Elliott wave theory
Advanced trading with Elliott waves
Don't miss my next trading insight. To receive all my spread betting blog posts by email, as soon as I've written them, just sign up here .
Get the latest financial news, insights and expert analysis from our award-winning MoneyWeek team, to help you understand what really matters when it comes to your finances.
John is is a British-born lapsed PhD physicist, who previously worked for Nasa on the Mars exploration team. He is a former commodity trading advisor with the US Commodities Futures Trading Commission, and worked in a boutique futures house in California in the 1980s.
He was a partner in one of the first futures newsletter advisory services, based in Washington DC, specialising in pork bellies and currencies. John is primarily a chart-reading trader, having cut his trading teeth in the days before PCs.
As well as his work in the financial world, he has launched, run and sold several 'real' businesses producing 'real' products.
-
 Inheritance tax investigations net HMRC an extra £246m from bereaved families
HMRC embarked on almost 4,000 probes into unpaid inheritance tax in the year to last April, new figures show, in an increasingly tough crackdown on families it thinks have tried to evade their full bill
-
 Average UK house price reaches £300,000 for first time, Halifax says
While the average house price has topped £300k, regional disparities still remain, Halifax finds.