How long can the euro's rally last?
John C Burford asks if the euro is likely to resume its bear market, or whether we will see an extension to its recent rally.
Get the latest financial news, insights and expert analysis from our award-winning MoneyWeek team, to help you understand what really matters when it comes to your finances.
You are now subscribed
Your newsletter sign-up was successful
Want to add more newsletters?

Twice daily
MoneyWeek
Get the latest financial news, insights and expert analysis from our award-winning MoneyWeek team, to help you understand what really matters when it comes to your finances.

Four times a week
Look After My Bills
Sign up to our free money-saving newsletter, filled with the latest news and expert advice to help you find the best tips and deals for managing your bills. Start saving today!
Over the weekend, the Spanish banks' bail-out was put in place, and markets overnight have extended last week's gains with huge openings. These dramatic moves have taken several markets to my original targets, including the euro, which I will cover today. I will get to the Dow later this week, as promised.
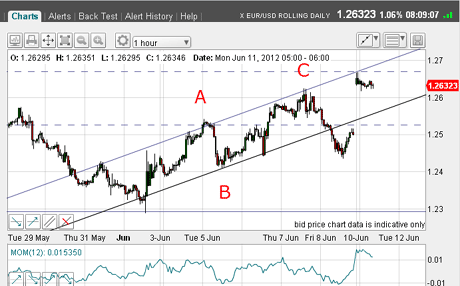
Recall, on Thursday I had taken a profit on my long trade at the C wave high and taken a new short position:

(Click on the chart for a larger version)
MoneyWeek
Subscribe to MoneyWeek today and get your first six magazine issues absolutely FREE

Sign up to Money Morning
Don't miss the latest investment and personal finances news, market analysis, plus money-saving tips with our free twice-daily newsletter
Don't miss the latest investment and personal finances news, market analysis, plus money-saving tips with our free twice-daily newsletter
On Friday, the market retreated and broke below my lower tramline. That was a potentially bearish development and my new short trade was looking very good.
But markets hold many surprises and I fell victim to one of them as I will describe.
Late on Friday, the market rallied and tried to kiss the tramline. That normally would be a great place to enter short trades.
But I smelt a rat.
Why I didn't press my short trade
I knew that the crisis in the eurozone would be coming to a head soon with all eyes on Spanish banks. Surely, they would not be allowed to collapse without a fight from the money men?
That is why I judged that this was not the time to press the short side. After all, only about a week ago, the EUR/USD had fallen sharply by five cents and bullish sentiment was on the floor.
That is why I had a feeling that my A-B-C rally labels could well be part of a larger A-B-C pattern.
So I kept my buy-stop at the 1.26 level at break-even. And with today's big up gap, I was taken out at the 1.2640 level on the opening for a 40 pip loss.
I placed this against my previous 240 pip gain for a net 200 pip profit.
Not bad, considering many traders would be nursing much larger losses on short trades. The army of shorts would have many protective buy-stops placed at the obvious position just above my old wave C high at the 1.26 area. And these were taken out on today's opening.
A new trade pattern in the making
Getting back to the above chart can you see that there is a larger A-B-C pattern in the making? The new large A wave is my old C wave, Friday's low is my new B wave and there could be the making the new C wave as I write.
The rally has carried to the extension of my upper tramline, which is resistance.
So, can I say that this is the rally high? After all, we have tramline resistance, there is a potential C wave high, and this morning's rally has carried to an exact Fibonacci 38% retrace of the May decline.
I mentioned that the rally has carried to one of my original rally targets. I set that at the 1.27 area, and the market has come within 30 pips this morning. I consider that a hit.
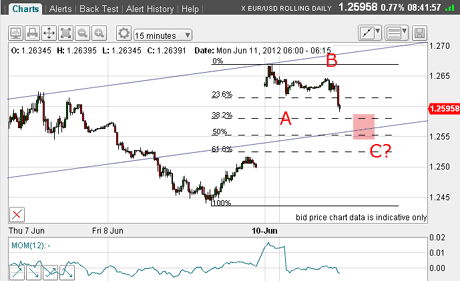
But will the rally extend? As I write, the market is coming off. This is typical behaviour gaps tend to be filled, or at least partially so. I will be watching the Fibonacci levels with eagle eyes:

(Click on the chart for a larger version)
On the 15-minute chart, we have a potential A-B-C. I shall assume this is the pattern being formed and if so, that implies another stab up soon.
The ideal turn for wave C is the area of the pink bar.
But the market has made a huge almost unprecedented gap opening, which has squeezed a lot of shorts. With these out of the way, can the market resume its bear market, or will we see a rally extension?
If the market does get to my pink bar, I might chicken out and take the profit on my new short trade. That is because at present, I have nothing to help me answer the above question.
There have been significant developments in the Dow which I want to cover on Wednesday, all being well.
Before I leave, I had a timely comment on US interest rates on Friday and already, they are rising today. The T-Bonds have tumbled by five handles' (the large number ahead of the decimal) in a week or so. I believe the bonds are trying to tell us something, and it isn't good (unless you are short, of course).
If you're a new reader, or need a reminder about some of the methods I refer to in my trades, then do have a look at my introductory videos:
The essentials of tramline trading
An introduction to Elliott wave theory
Advanced trading with Elliott waves
Don't miss my next trading insight. To receive all my spread betting blog posts by email, as soon as I've written them, just sign up here .
Get the latest financial news, insights and expert analysis from our award-winning MoneyWeek team, to help you understand what really matters when it comes to your finances.
John is is a British-born lapsed PhD physicist, who previously worked for Nasa on the Mars exploration team. He is a former commodity trading advisor with the US Commodities Futures Trading Commission, and worked in a boutique futures house in California in the 1980s.
He was a partner in one of the first futures newsletter advisory services, based in Washington DC, specialising in pork bellies and currencies. John is primarily a chart-reading trader, having cut his trading teeth in the days before PCs.
As well as his work in the financial world, he has launched, run and sold several 'real' businesses producing 'real' products.
-
 ISA fund and trust picks for every type of investor – which could work for you?
Whether you’re an ISA investor seeking reliable returns, looking to add a bit more risk to your portfolio or are new to investing, MoneyWeek asked the experts for funds and investment trusts you could consider in 2026
-
 The most popular fund sectors of 2025 as investor outflows continue
It was another difficult year for fund inflows but there are signs that investors are returning to the financial markets