Did gold make a major low last week?
Many traders have pinned their hopes - and their cash - on gold falling below the critical $1,525 level. But as John C Burford explains, they could be staring disappointment in the face - again.
Get the latest financial news, insights and expert analysis from our award-winning MoneyWeek team, to help you understand what really matters when it comes to your finances.
You are now subscribed
Your newsletter sign-up was successful
Want to add more newsletters?

Twice daily
MoneyWeek
Get the latest financial news, insights and expert analysis from our award-winning MoneyWeek team, to help you understand what really matters when it comes to your finances.

Four times a week
Look After My Bills
Sign up to our free money-saving newsletter, filled with the latest news and expert advice to help you find the best tips and deals for managing your bills. Start saving today!
table.ben-table table { border: 1px solid #2b1083;font: verdana, arial, sans-serif; }
th { background: #2b1083; padding: 2px 1px;color: white;font-weight: bold;text-align: center;border-left: 1px solid #a6a6c9; font-size: .8em;}th.first { border-left: 0; padding: 2px 1px;text-align: left; font-size: .8em;}
tr {background: #fff;}
MoneyWeek
Subscribe to MoneyWeek today and get your first six magazine issues absolutely FREE

Sign up to Money Morning
Don't miss the latest investment and personal finances news, market analysis, plus money-saving tips with our free twice-daily newsletter
Don't miss the latest investment and personal finances news, market analysis, plus money-saving tips with our free twice-daily newsletter
tr.alt {background: #f6f5f9; }
td { padding: 2px 1px;text-align: center;border-left: 1px solid #a6a6c9;color: #000;vertical-align: center; font-size: .8em;}td.alt { background-color: #f6f5f9; }
td.bold { font-weight: bold;}td.first { text-align: left; }
td.left { text-align: left; }
With so much action in the Dow and the euro recently, I have rather neglected the gold market but that changes today. Important developments are afoot.
My last post was on 27 February well over a month ago. And since then, the market has come under severe pressure.
But with the sentiment overwhelmingly bearish, I have been on the lookout for a low. That has been my stance for a few weeks.
For some, that may sound crazy. But remember, markets follow sentiment and when sentiment becomes extreme, that is when turns are very likely to occur. At these times, the weak bulls have long gone, and there are few remaining bears who have not taken short positions. There are simply too few bears left without a position to keep the trend going.
Interestingly, over the past few weeks, as the market has failed to rally, there has been a tsunami of negative press on gold's prospects over the medium term.
In fact, the most common belief now is that gold will fall beneath the critical $1,525 support that is on everyone's chart.
And because everyone is watching it, the market will probably not approach it, at least for some time. We could see a major short squeeze before that.
Here are some bearish comments I spotted (my bold): "Credit Suisse reported on Wednesday to cut its outlook on gold prices for the next couple of years. The bank cut its average price forecast for gold this year 9.2% to $1,580 a troy ounce and its 2014 average price forecast 12.8% to $1,500/oz... Societe Generale recently called an end to the gold era and forecast a drop in prices to $1,375 an ounce by the year's end."
That is pretty bearish, is it not?
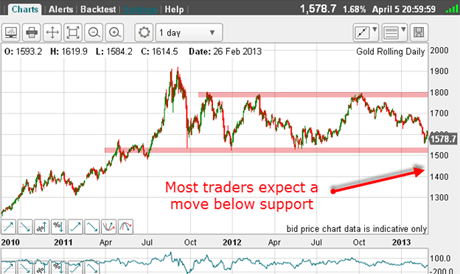
So let's review where we were in late February:
(Click on the chart for a larger version)
This is the daily chart showing the upper resistance band in the $1,800 area, and the lower support zone in the $1,525 region. Since October 2011, the market has traded between these zones. You can think of them as horizontal tramlines.
But since the $1,800 high was put in last October, the market has drifted down along with a totally predictable commensurate increase in bearish sentiment.
My secret vice
As another measure of the increasing bearishness, here is the latest Commitments of Traders (COT) data:
| OPEN INTEREST: 417,176 | ||||||||
| COMMITMENTS | ||||||||
| 202,634 | 82,428 | 25,084 | 137,205 | 279,727 | 364,923 | 387,239 | 52,253 | 29,937 |
| CHANGES FROM 03/26/13 (CHANGE IN OPEN INTEREST: -2,551) | ||||||||
| 2,245 | 14,485 | 653 | -2,383 | -18,334 | 515 | -3,196 | -3,066 | 645 |
| PERCENT OF OPEN INTEREST FOR EACH CATEGORY OF TRADERS | ||||||||
| 48.6 | 19.8 | 6.0 | 32.9 | 67.1 | 87.5 | 92.8 | 12.5 | 7.2 |
| NUMBER OF TRADERS IN EACH CATEGORY (TOTAL TRADERS: 358) | ||||||||
| 188 | 86 | 73 | 62 | 50 | 278 | 188 | Row 8 - Cell 7 | Row 8 - Cell 8 |
The large specs (non-commercials), although still very long the market, significantly added to their short positions that week. This is telling me that as the market declined, the hedge funds (non-commercials) became much more bearish. Remember, hedge funds are mostly trend-followers, so they were using the established momentum of the downtrend as their trading guide.
But one thing the average hedge fund is not good at is spotting trend changes.
And that is where we come in!
There is nothing more satisfying than trading against the hedgies and seeing them run for cover as the market moves swiftly against them. But that is my secret vice it may not be yours.
In practical terms, when you can spot a trend reversal and catch the hedge funds on the hop, the moves are likely to be swift as we saw on Friday because they control the bulk of the futures market.
A signal that we're near a low
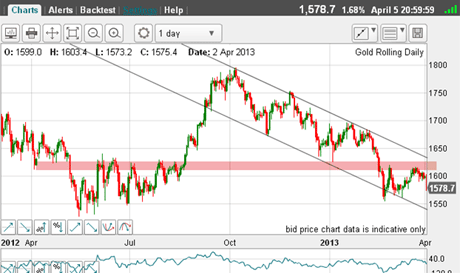
OK, let's back up to last week, when I was looking for a low. Here is the chart as of late March:
(Click on the chart for a larger version)
I have my original tramline pair, and the market made two attempts to break through the solid zone of resistance which goes back to last summer, making it doubly important.
This resistance was likely to be a tough nut to crack, and sure enough, the market was being repulsed by it.
So last week, I had a situation where there was huge resistance in the $1,620 area and massive long-term support up to $100 below. It seemed trapped there until it could break out one way or the other.
Note also on the above chart the latest dip broke below the lower tramline in an overshoot'. Because I consider my tramlines as very secure (lots of good touch points), this overshoot and rapid pull-back told me we are close to a low.
In Friday'spost on the Dow, I showed an overshoot at the high, which lead to a decline. This action in gold is entirely the same, but in reverse.
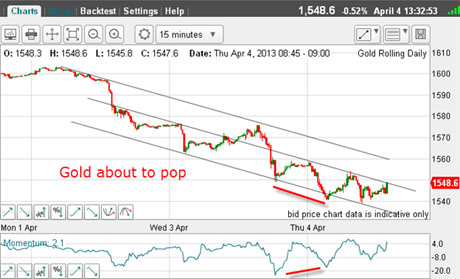
It was time to look at the 15-minute chart and this is what I saw on Thursday:
(Click on the chart for a larger version)
I have a terrific tramline trio and a positive-momentum divergence has formed.
I wrote on the chart then that gold was about to pop and pop it did.
I entered my trade under $1,550 and placed a protective stop just under the low at $1,540 for a very low-risk trade.
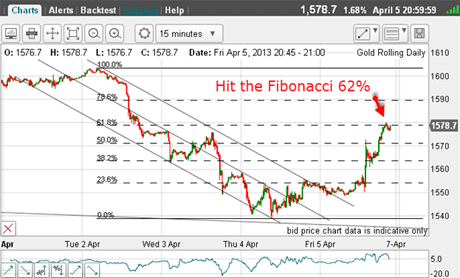
Now, with the huge short squeeze on Friday, this is how the market moved:
(Click on the chart for a larger version)
Nice pop! But does it have higher potential, or is that it?
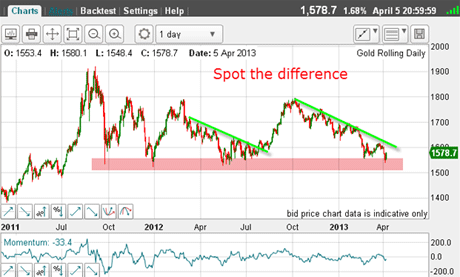
Here is the daily chart again and note the similarity between the action last year and now:
(Click on the chart for a larger version)
We have a steadily declining market with the highs following the downtrend line (green bars) of similar slope. And the length of time in these downtrends are roughly the same.
If history repeats, we could well see another sharp rally of perhaps $200 or so back up to the $1,800 area.
That would put the cat amongst the pigeons alright. But you can be sure there are masses of buy-stops above the highs the first one at around $1,620.
More negative sentiment for gold
As another measure of negative trader sentiment, here are two headlines I came across last week:
Why gold, silver and mining stocks are headed lower
A few weeks ago, it would have been heresy to publish such titles! But now, negative opinion pieces are very common.
Gold is foremost in many investors' thoughts at the moment.
It is not difficult to see why sentiment changed. For one thing, many gold bugs have bought into the idea that fiat currencies are doomed with all the money-printing taking place. But since the 2011 high at $1,920, the market switched off to this story and this has disheartened the bulls, prompting many to sell in disgust (they had been hoping for at least $2,000).
Also, many had been expecting hyperinflation by now, but this has not materialised. So what reason do they have for holding this barbarous relic' as an inflation hedge?
And the hedge funds, sniffing a new down-trend in the making, have jumped on board, and this has put added pressure on gold.
At one stage, I saw a sentiment reading of less than 10% bulls. To me, that was simply staggering. Around the $1,920 high, sentiment was over 95% bulls.
But with such negative sentiment, the market still could not break the critical $1,525 support in fact, the low is $1,540, so far.
Is this yet another time when a common target is approached, but not quite hit a theme I have covered many times?
For now, I have a great long position with my stop at break-even. If this rally is corrective, I expect at least an A-B-C form, so this first leg up could be the A wave, leading to the B wave down, and then a new up-move in a C wave.
I have not changed my long-term bearish view on gold, be assured. But if I can take a good profit from a long trade, I will not let my long-term view spoil it.
If you're a new reader, or need a reminder about some of the methods I refer to in my trades, then do have a look at my introductory videos:
The essentials of tramline trading
An introduction to Elliott wave theory
Advanced trading with Elliott waves
Don't miss my next trading insight. To receive all my spread betting blog posts by email, as soon as I've written them, just sign up here . If you have any queries regarding MoneyWeek Trader, please contact us here.
Get the latest financial news, insights and expert analysis from our award-winning MoneyWeek team, to help you understand what really matters when it comes to your finances.
John is is a British-born lapsed PhD physicist, who previously worked for Nasa on the Mars exploration team. He is a former commodity trading advisor with the US Commodities Futures Trading Commission, and worked in a boutique futures house in California in the 1980s.
He was a partner in one of the first futures newsletter advisory services, based in Washington DC, specialising in pork bellies and currencies. John is primarily a chart-reading trader, having cut his trading teeth in the days before PCs.
As well as his work in the financial world, he has launched, run and sold several 'real' businesses producing 'real' products.
-
 UK interest rates live: experts expect MPC to hold rates
The Bank of England’s Monetary Policy Committee (MPC) meets today to decide UK interest rates. The last meeting resulted in a cut, but experts think there is little chance of interest rates falling today.
-
 MoneyWeek Talks: The funds to choose in 2026
Podcast Fidelity's Tom Stevenson reveals his top three funds for 2026 for your ISA or self-invested personal pension