Did the Dow finally top out on Tuesday?
After a long wait, the odds seem to be turning in favour of the US stock markets having reached a top, says John C Burford. Here he looks for evidence in the charts.
Get the latest financial news, insights and expert analysis from our award-winning MoneyWeek team, to help you understand what really matters when it comes to your finances.
You are now subscribed
Your newsletter sign-up was successful
Want to add more newsletters?

Twice daily
MoneyWeek
Get the latest financial news, insights and expert analysis from our award-winning MoneyWeek team, to help you understand what really matters when it comes to your finances.

Four times a week
Look After My Bills
Sign up to our free money-saving newsletter, filled with the latest news and expert advice to help you find the best tips and deals for managing your bills. Start saving today!
I have been waiting and waiting for stock markets to top out. And it appears the odds now slightly favour the US stock markets having turned.
As you may know, I have been a stock market bear for some time, as I see the rally since the 2009 lows in terms of a bear market rally.
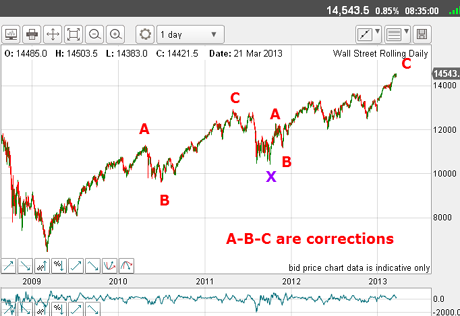
Beloware the long-term Elliott waves in the Dow I have been working with.
MoneyWeek
Subscribe to MoneyWeek today and get your first six magazine issues absolutely FREE

Sign up to Money Morning
Don't miss the latest investment and personal finances news, market analysis, plus money-saving tips with our free twice-daily newsletter
Don't miss the latest investment and personal finances news, market analysis, plus money-saving tips with our free twice-daily newsletter
To me, the structure is clearly an A-B-C, then X, then another A-B-C. This is a corrective pattern, not an impulsive one.
Most people are calling this huge move off the 2009 lows as a secular bull market. But markets exist to bring together people of opposing beliefs, so I demur.
(Click on the chart to see a larger version)
Note that the final C wave has a clear five-wave pattern about it from the B wave low.
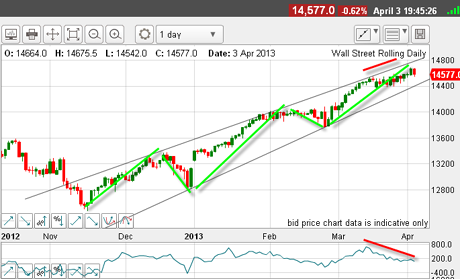
Let's look at that final C wave, which started last November from this B wave low:
(Click on the chart to see a larger version)
Here again, there is a clear five-wave pattern to yesterday's high within this C wave.
Not only that, but the thrust to Tuesday's 14,680 high shows a striking negative momentum divergence(red bars).
The pattern above is a rising wedge and these nearly always resolve in an opposite move - in this case, down.
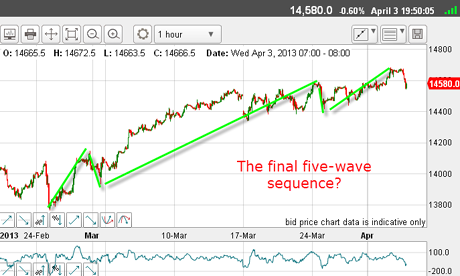
And now let's look at the fifth and final wave which started in late February:
(Click on the chart to see a larger version)
Here again, I can count a clear five-wave sequence.
Remember, fifth waves are ending waves.
Putting all of this together, I can count an ending large C wave and two fifth waves of progressively smaller degree.
A sign of an exhausted market
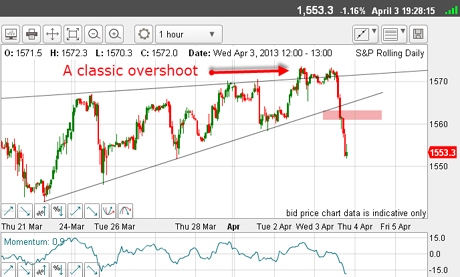
Now let's look over at the S&P chart for another perspective on the US stock markets. This is the hourly chart I took on Wednesday:
(Click on the chart to see a larger version)
The market has also traced out a rising wedge, but the point to notice is that yesterday morning, the market made a thrust above the upper boundary line in an overshoot.
This is a significant feature.
Then as the day progressed, heavy selling emerged and forced the market below the lower boundary line to give a sell signal in the pink zone.
The overshoot I mentioned is a classic feature of exhausted markets. It seems as if the fumes in the bull market tank are only enough to push the market up slightly before a reversal kicks in.
Incidentally, there are several measures of the internal state of the markets that I follow, from advance/decline measures, trading volumes, and sentiment indicators to mention a few. The vast majority have confirmed this bull market is living on borrowed time.
So how am I playing this?
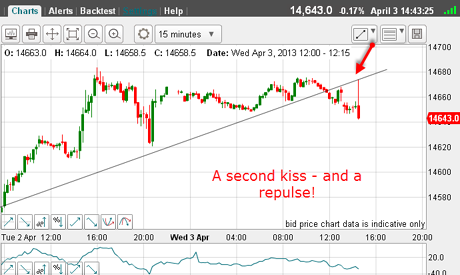
This is the 15-minute chart from Wednesday in the Dow:
(Click on the chart to see a larger version)
I had my tramline drawn and when the market broke below it, I entered my short trade. I placed my stop just above the 14,680 high for a very low risk trade.
But the market was reluctant to leave the party and it came back for two kisses - both to the underside of my tramline.
But that was it. The party was over (at least for now), as the market experienced a scalded cat bounce down.
This was pure textbook reversal behaviour on this 15-minute chart.
So what are the options now?
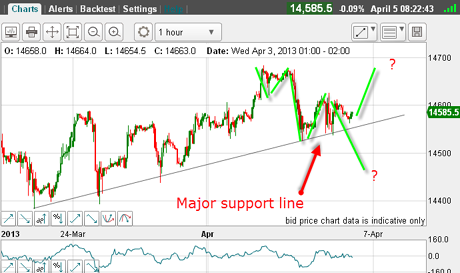
Here is the hourly chart this morning:
(Click on the chart to see a larger version)
If I have nailed the 14,680 top as the high, I have waves 1 and 2 in place, and we are currently in a third (or fourth) wave.
But at this stage, with the market still trading above my major support line, all I can say is that this third wave has two options. First, it could turn out to be a third wave of a five-wave sequence down.
In this case, I would expect the support line to give way. This would be a good place to trade.
A very happy trader
Alternatively, this third wave could turn out to be the C wave of an A-B-C correction, in which case, the market would not break my support line, and Tuesday's high at 14,680 would be tested.
So my line in the sand is the support line.
But as a trader, I try not to pre-judge the outcome of this tussle. I have made my bet and have now moved my protective stop to break-even, so whatever happens, I will suffer no loss.
And that sentiment of avoiding loss is uppermost in my mind. If all my trades were no-loss affairs, I would be a very happy trader! Truisms like this remain necessary, because successful trading depends very much on honing the correct attitude.
Now, if the market breaks the support line on the above chart, that is signal number one that the high is in.
But my focus is on the wedge formation on the second chart I showed you. If the lower boundary line is to be broken, that will be my supreme shorting signal. This lies in the 14,400 region.
If you're a new reader, or need a reminder about some of the methods I refer to in my trades, then do have a look at my introductory videos:
The essentials of tramline trading
An introduction to Elliott wave theory
Advanced trading with Elliott waves
Don't miss my next trading insight. To receive all my spread betting blog posts by email, as soon as I've written them, just sign up here . If you have any queries regarding MoneyWeek Trader, please contact us here.
Get the latest financial news, insights and expert analysis from our award-winning MoneyWeek team, to help you understand what really matters when it comes to your finances.
John is is a British-born lapsed PhD physicist, who previously worked for Nasa on the Mars exploration team. He is a former commodity trading advisor with the US Commodities Futures Trading Commission, and worked in a boutique futures house in California in the 1980s.
He was a partner in one of the first futures newsletter advisory services, based in Washington DC, specialising in pork bellies and currencies. John is primarily a chart-reading trader, having cut his trading teeth in the days before PCs.
As well as his work in the financial world, he has launched, run and sold several 'real' businesses producing 'real' products.
-
 Can mining stocks deliver golden gains?
With gold and silver prices having outperformed the stock markets last year, mining stocks can be an effective, if volatile, means of gaining exposure
-
 8 ways the ‘sandwich generation’ can protect wealth
People squeezed between caring for ageing parents and adult children or younger grandchildren – known as the ‘sandwich generation’ – are at risk of neglecting their own financial planning. Here’s how to protect yourself and your loved ones’ wealth.