A great trade in the EUR/GBP
The charts had called time on the euro bull-run long before the newspapers got wind of it, says John C Burford. And the charts can tell you when it's time to take profits too.
Get the latest financial news, insights and expert analysis from our award-winning MoneyWeek team, to help you understand what really matters when it comes to your finances.
You are now subscribed
Your newsletter sign-up was successful
Want to add more newsletters?

Twice daily
MoneyWeek
Get the latest financial news, insights and expert analysis from our award-winning MoneyWeek team, to help you understand what really matters when it comes to your finances.

Four times a week
Look After My Bills
Sign up to our free money-saving newsletter, filled with the latest news and expert advice to help you find the best tips and deals for managing your bills. Start saving today!
I follow the EUR/GBP market closely and until recently, the euro was gaining on the pound. The EUR/GBP recently gave me a great trade, where I used my tramline and Fibonacci methods to pinpoint the entry and exit points with high accuracy.
There is a convincing story behind this upmove from last summer. While eyes were averted from the eurozone crisis this was pre-Cyprus - they came to see that the economic news out of the UK was deteriorating. So that was the major theme.
But as all traders should know, when the picture is painted at its blackest, that is often the time to look for a major turn. And that is what I did around mid-March.
MoneyWeek
Subscribe to MoneyWeek today and get your first six magazine issues absolutely FREE

Sign up to Money Morning
Don't miss the latest investment and personal finances news, market analysis, plus money-saving tips with our free twice-daily newsletter
Don't miss the latest investment and personal finances news, market analysis, plus money-saving tips with our free twice-daily newsletter
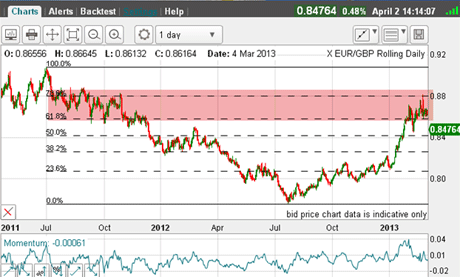
The run-up from last summer was spectacular, and this was the picture then:
(Click on the chart for a larger version)
The market had rallied from the 0.78 area last summer and was entering the broad band of chart resistance (pink zone) from 2011 in the 0.88 area.
Remember, markets have long memories, and I expected this resistance to be respected...
And on 25 February, the market spiked up to hit the Fibonacci 76% level on the nose. That was my first hint that the rally might be over.
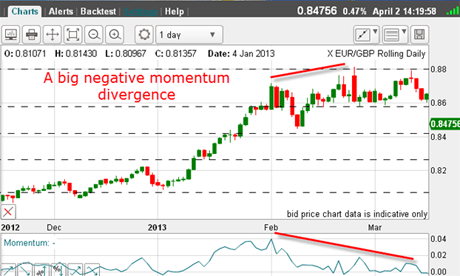
If I zoom in on this top area...
(Click on the chart for a larger version)
you can see there is a massive negative-momentum divergence at the tops. That is my second hint.
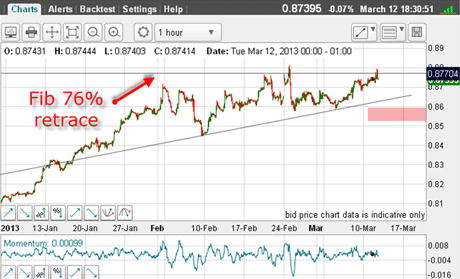
And here is the hourly chart:
(Click on the chart for a larger version)
This was the picture I had on 12 March, when I was suspecting a top but I needed more confirmation in order to place a definite trade. The pink bar is the danger zone for the rally.
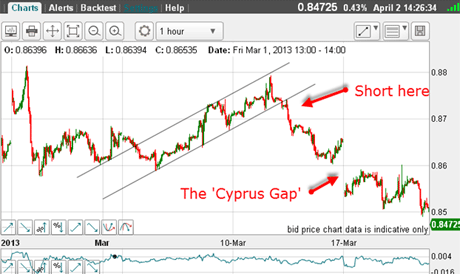
Here is a closer look:
(Click on the chart for a larger version)
I could draw in a very good-looking tramline pair, as the market was reaching for the 0.88 level. When the market retreated and broke the lower tramline, I had my entry.
And I was well rewarded on the following Monday when the Cyprus banking difficulties became known creating the Cyprus gap'.
Let's keep this gap in mind for future reference.
All of a sudden, eyes swung back to the eurozone and away from the UK's poor data. Aren't traders fickle? One moment they love the euro and the next, they fall in love with the pound. But a good trader can use this to his orher advantage.
So I had a very good entry and the trade was working in my direction. But note that when I made that short entry, I had no idea that there would be a problem with little Cyprus a few days later.
That is where technical trading with a proven system proves its worth. If you trade off the news, you either miss a large part of the move, or it has already been discounted and the market moves against you to your utter frustration.
So remember, the market makes the news - not the reverse.
OK, so where to take profits on my short trade?
Where to get out of this trade
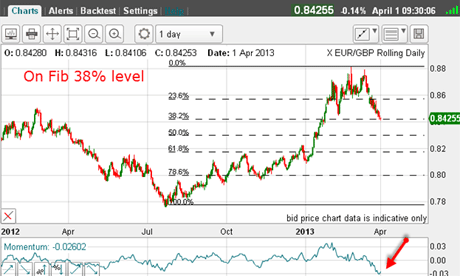
Let's forward to 1 April, where this was the chart:
(Click on the chart for a larger version)
The market had fallen to the Fibonacci 38% level potential support. that was clue number one.
Then, momentum on the daily had likewise fallen to a very low reading (red arrow). This was a sign that the decline had been overdone, in all likelihood.
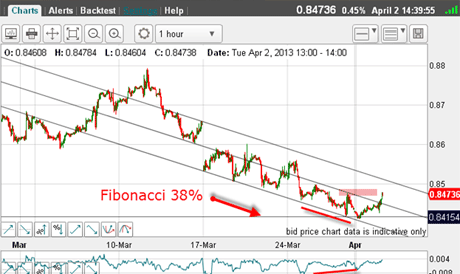
And when I zoomed in on the hourly chart, I had clue number two:
(Click on the chart for a larger version)
The market had hit the Fibonacci 38% level and was making a positive-momentum divergence. It was alsohitting my very secure lower tramline!
That was all the evidence I needed to grab my profits of 350 pips and retire.
But there was another great trade available. As I write, the market has bounced up, broken my centre tramline and risen above the previous minor high (pink bar).
A new long trade is presented for a nimble trader.
But where are the upside targets now?
The first target is, of course, on the upper tramline.
The second target is our friend, the Cyprus gap, which seems to be crying out to get filled.
And because I expect these two currencies to remain volatile this year, this market will continue to present more great trading opportunities. I shall keep this one on my radar.
If you're a new reader, or need a reminder about some of the methods I refer to in my trades, then do have a look at my introductory videos:
The essentials of tramline trading
An introduction to Elliott wave theory
Advanced trading with Elliott waves
Don't miss my next trading insight. To receive all my spread betting blog posts by email, as soon as I've written them, just sign up here . If you have any queries regarding MoneyWeek Trader, please contact us here.
Get the latest financial news, insights and expert analysis from our award-winning MoneyWeek team, to help you understand what really matters when it comes to your finances.
John is is a British-born lapsed PhD physicist, who previously worked for Nasa on the Mars exploration team. He is a former commodity trading advisor with the US Commodities Futures Trading Commission, and worked in a boutique futures house in California in the 1980s.
He was a partner in one of the first futures newsletter advisory services, based in Washington DC, specialising in pork bellies and currencies. John is primarily a chart-reading trader, having cut his trading teeth in the days before PCs.
As well as his work in the financial world, he has launched, run and sold several 'real' businesses producing 'real' products.
-
 ISA fund and trust picks for every type of investor – which could work for you?
Whether you’re an ISA investor seeking reliable returns, looking to add a bit more risk to your portfolio or are new to investing, MoneyWeek asked the experts for funds and investment trusts you could consider in 2026
-
 The most popular fund sectors of 2025 as investor outflows continue
It was another difficult year for fund inflows but there are signs that investors are returning to the financial markets