Despite all its volatility, the Dow sticks to the script
The current action in the Dow Jones is providing some excellent examples of how to use tramline, Elliott, and Fibonacci methods to negotiate the market's twists and turns.
Get the latest financial news, insights and expert analysis from our award-winning MoneyWeek team, to help you understand what really matters when it comes to your finances.
You are now subscribed
Your newsletter sign-up was successful
Want to add more newsletters?

Twice daily
MoneyWeek
Get the latest financial news, insights and expert analysis from our award-winning MoneyWeek team, to help you understand what really matters when it comes to your finances.

Four times a week
Look After My Bills
Sign up to our free money-saving newsletter, filled with the latest news and expert advice to help you find the best tips and deals for managing your bills. Start saving today!
What a difference a day makes!
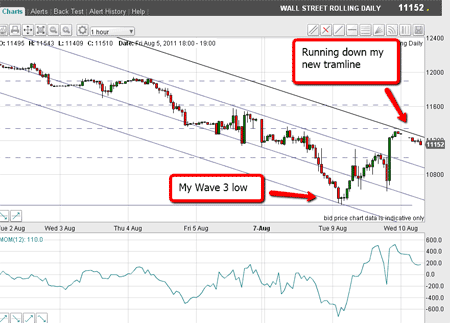
When I wrote yesterday morning, the Dow had rallied to my new fourth tramline and was eating into overhead resistance.
Here is the chart from yesterday:
MoneyWeek
Subscribe to MoneyWeek today and get your first six magazine issues absolutely FREE

Sign up to Money Morning
Don't miss the latest investment and personal finances news, market analysis, plus money-saving tips with our free twice-daily newsletter
Don't miss the latest investment and personal finances news, market analysis, plus money-saving tips with our free twice-daily newsletter

(Click on the chart for a larger version)
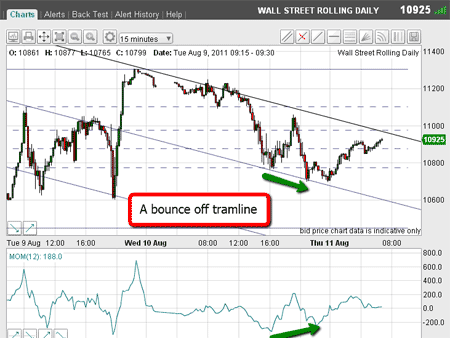
Because of this overhead resistance (where many traders had finally plucked up the courage to get short!), I expected a pull-back from my fourth tramline and this is what occurred:

(Click on the chart for a larger version)
The market did indeed fall back to my third tramline at 10,800.
The market is sticking firmly within the tramlines
This was an important Fibonacci level the 61.8% retrace of the wave up from the 10,450 low to the late Tuesday's 11,300 high.
That was a super place to go long (for very short-term traders).
A good rally off the 10,800 level took the market to just shy of the fourth tramline, and then it fell back right back to my third tramline again.
This second test was again successful, and currently the market is once again testing my fourth tramline.
This second test has a positive momentum divergence (marked by green arrows). This fact gives a clue that the test will likely be successful.
And notice how the market reversed pretty much right on my third tramline. With such a volatile market, this is extraordinary, is it not?
Remember, I drew my tramlines many hours before these events. It is as if the market knows' the importance of these lines.
Now, these swings are anywhere between 200 and 500 pips - and all in a few hours. This market is definitely not for widows and orphans!
The moment of truth approaches
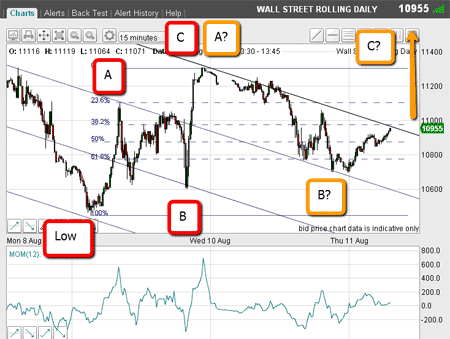
OK, so where are we now? The rally off the 10,450 low has an A-B-C pattern.

(Click on the chart for a larger version)
I have drawn the first A-B-C in red.
Normally, I would look to short the market (it is in a downtrend, after all) near the wave C high, and that would have worked out for a short-term trade, taking profits on the dip to the third tramline for a nice 500 pip profit.
But after such a collapse off the 12,800 July high, this A-B-C pattern looks to be just noise on the daily chart, and if my 10,450 low is a significant low, I need to see more upside development over a longer time-scale.
That is why I favour the view that this first A-B-C pattern may well be part of a larger one.
I have tentatively marked my larger A-B-C in yellow.
To confirm, the market must move above the red A wave at the 11,300 level.
Of course, this potential larger A-B-C pattern may well become part of an even larger corrective pattern. I will let the market decide, as ever.
But as I write, the market is trading at 10,960 - and right at the fourth tramline. This is the moment of truth!
Where next?
By the time you read this, the market will have decided what to do from here.
If my tramline holds, the market will move back down.
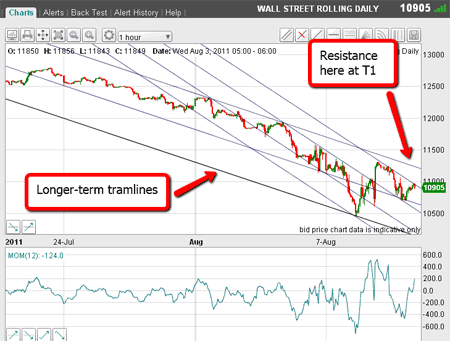
But if it does move up from here, we must keep an eye on the longer-term tramline set:

(Click on the chart for a larger version)
The longer-term tramline trio is the set with the shallower slope. If the market can punch above the 11,000 level, the next target is the T1 tramline at the 11,200 area.
Meanwhile, short trades taken this morning at the fourth tramline at the 10,950 area will be protected by a stop using my 3% rule.
The target is sub-10,800.
If the market drops by 80 pips off the high this morning, I will move my stops to break-even, following my break even rule.
Incidentally, I am keeping a sharp eye on gold and hope to write on it very soon.
I have been focusing on the Dow as it has provided a wealth of living examples of how to use tramline, Elliott, and Fibonacci methods to negotiate the twists and turns of these very tricky markets.
I hope you are enjoying the ride!
Don't miss my next trading insight. To receive all my spread betting blog posts by email, as soon as I've written them, just sign up here .
Get the latest financial news, insights and expert analysis from our award-winning MoneyWeek team, to help you understand what really matters when it comes to your finances.
John is is a British-born lapsed PhD physicist, who previously worked for Nasa on the Mars exploration team. He is a former commodity trading advisor with the US Commodities Futures Trading Commission, and worked in a boutique futures house in California in the 1980s.
He was a partner in one of the first futures newsletter advisory services, based in Washington DC, specialising in pork bellies and currencies. John is primarily a chart-reading trader, having cut his trading teeth in the days before PCs.
As well as his work in the financial world, he has launched, run and sold several 'real' businesses producing 'real' products.
-
 Inheritance tax investigations net HMRC an extra £246m from bereaved families
HMRC embarked on almost 4,000 probes into unpaid inheritance tax in the year to last April, new figures show, in an increasingly tough crackdown on families it thinks have tried to evade their full bill
-
 Average UK house price reaches £300,000 for first time, Halifax says
While the average house price has topped £300k, regional disparities still remain, Halifax finds.