Can the rally in the FTSE 100 continue?
The last time the rally in the FTSE 100 stalled, bullish sentiment was high - is history about to repeat itself? John C Burford examines the charts.
Get the latest financial news, insights and expert analysis from our award-winning MoneyWeek team, to help you understand what really matters when it comes to your finances.
You are now subscribed
Your newsletter sign-up was successful
Want to add more newsletters?

Twice daily
MoneyWeek
Get the latest financial news, insights and expert analysis from our award-winning MoneyWeek team, to help you understand what really matters when it comes to your finances.

Four times a week
Look After My Bills
Sign up to our free money-saving newsletter, filled with the latest news and expert advice to help you find the best tips and deals for managing your bills. Start saving today!
I have just returned from a very successful MoneyWeek Trader workshop and I hope everyone there had as much fun as I did. I was asked some very pertinent questions, and we discovered some revealing patterns on the live charts. Altogether, it was a great day!
While I was away, we saw an unrelenting rise in stock markets. This is a stark illustration of a theme that is at the heart of how markets work and how they turn.
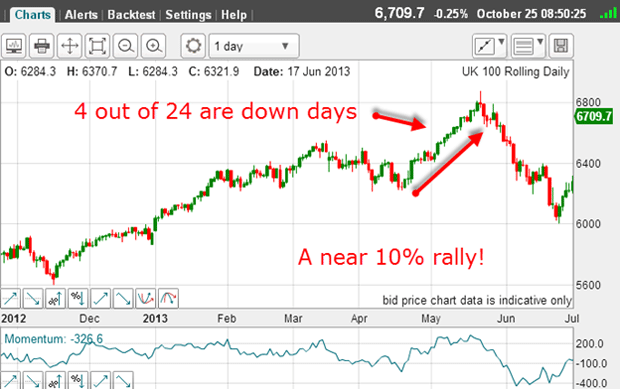
Here is the FTSE daily chart for an eight-month span:
MoneyWeek
Subscribe to MoneyWeek today and get your first six magazine issues absolutely FREE

Sign up to Money Morning
Don't miss the latest investment and personal finances news, market analysis, plus money-saving tips with our free twice-daily newsletter
Don't miss the latest investment and personal finances news, market analysis, plus money-saving tips with our free twice-daily newsletter

The area I want to focus on is the final run to the 22 May top a high which still stands.
This area stands out because of the sheer slope of the rise. This slope far exceeds anything that preceded it.
Now, this section lasted 24 days and in that period, there were only four down (red) days. And the rise was over 600 points (a rise of almost 10% in the index!)
That is a massive move without any real set-backs. There were no decent-sized dips along this path. That is quite unusual.
When to swim against the tide
Evidently, with the buyers in full control and the bears retreating, an agreement had been reached that prices were going higher.
And as the market worked higher, more and more people were converted to the bullish camp because they sensed an even bigger leap upwards. The economic data and the Fed quantitative easing (QE) rumours were all stoking the bullish flames.
So, with the vast majority of traders bullish as we headed into the fateful 22 May date, could the rally be sustained? After all, the fundamentals' were still favourable. So was there anything that could stop the rally?
You also had to wonder if it would be crazy to be bearish and swim against this considerable tide.
At times like these, traders need to be more bearish. Traders should have recognised that as the market rose, the bulls would eventually run out of ammo because they had spent most of it in the run-up.
So when the bulls ran out of buying power, the market turned and the bears took control.
As the market fell after the 22 May high, the late-to-the-party bulls were therefore suffering losses and had to sell. This heavy selling pressure together with that of the newly-emboldened bears produced a decline that was about as fast as the rally.
You can see the excess of red bars over the green (up days) on the decline.
But you should also note that the fundamentals had not changed. So why had the rally turned into a rout?
The simple answer is that sentiment had changed and that is reflected in the sentiment readings.
With the market in decline, many bulls were converting to bears. In other words, trader sentiment was getting more bearish on the dip.
Factoring in trader sentiment
The market follows trader sentiment.
So I have to ask myself: how can I measure this trader sentiment? After all, if I can measure it and monitor its progress to a high bullish reading, I should be able to forecast where the market is likely to top out.
I could then place high-confidence short trades to take advantage of the forthcoming declines which is a trader's dream.
As it happens, there are several measures that give me clues, and I follow them avidly.
Sadly, there is no sentiment data published on the FTSE. But I use the US data as a proxy.
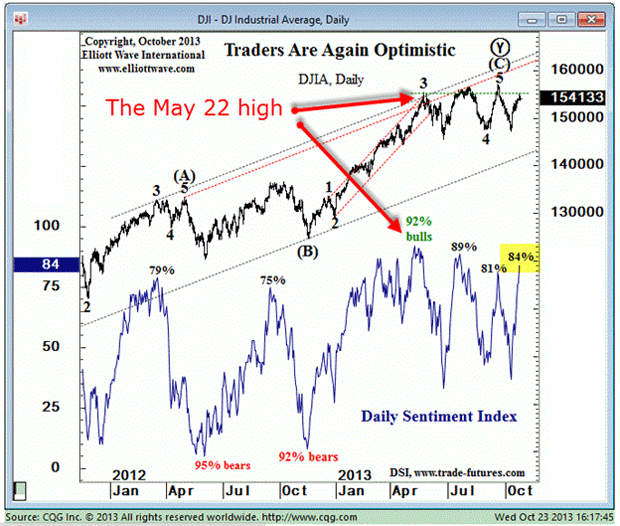
Here is the most recent Daily Sentiment Index (DSI) plot against the Dow:

(Chart courtesy of elliottwave.com)
It is evident that market highs are marked by very high bullish readings, and vice versa. In fact, this is an iron-clad rule: no significant market high is marked by a low bullish reading. I have never come across a situation that breaks this rule.
Don't get caught in the herd
And that was a major high.
Therefore, 92% of traders were totally wrong on 22 May.
This is a perfect example of the herding instinct.
My advice: when you run with the herd, make sure you escape before the DSI reading gets too high.
As a trader, I take advantage of this knowledge because an extreme bullishness always precedes a market reversal and I use my tramline method to pinpoint low-risk entries.
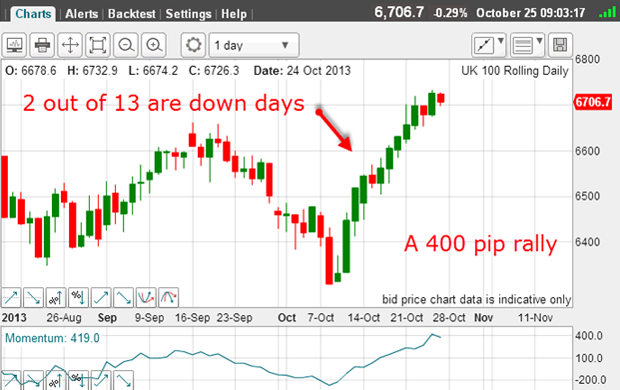
OK, let's examine the latest FTSE rally:

So far, the latest leg up has taken 13 days. And there have been only two down days. Does this remind you of the previous period?
The slope of the rally is also very steep, and the DSI on the Dow is approaching previous extremes where tops were made.
With this in mind, do you expect the market to continue its steep rally? Or do you think that the market will find a top in the near future before repeating the exercise, as occurred following the 22 May high?
Get the latest financial news, insights and expert analysis from our award-winning MoneyWeek team, to help you understand what really matters when it comes to your finances.
John is is a British-born lapsed PhD physicist, who previously worked for Nasa on the Mars exploration team. He is a former commodity trading advisor with the US Commodities Futures Trading Commission, and worked in a boutique futures house in California in the 1980s.
He was a partner in one of the first futures newsletter advisory services, based in Washington DC, specialising in pork bellies and currencies. John is primarily a chart-reading trader, having cut his trading teeth in the days before PCs.
As well as his work in the financial world, he has launched, run and sold several 'real' businesses producing 'real' products.
-
 Inheritance tax investigations net HMRC an extra £246m from bereaved families
HMRC embarked on almost 4,000 probes into unpaid inheritance tax in the year to last April, new figures show, in an increasingly tough crackdown on families it thinks have tried to evade their full bill
-
 Average UK house price reaches £300,000 for first time, Halifax says
While the average house price has topped £300k, regional disparities still remain, Halifax finds.