Apple’s in freefall – just as I predicted
Just as the charts predicted, Apple's share price is tumbling, says John C Burford. Proof that his methods don't just work on indices and currencies.
Get the latest financial news, insights and expert analysis from our award-winning MoneyWeek team, to help you understand what really matters when it comes to your finances.
You are now subscribed
Your newsletter sign-up was successful
Want to add more newsletters?

Twice daily
MoneyWeek
Get the latest financial news, insights and expert analysis from our award-winning MoneyWeek team, to help you understand what really matters when it comes to your finances.

Four times a week
Look After My Bills
Sign up to our free money-saving newsletter, filled with the latest news and expert advice to help you find the best tips and deals for managing your bills. Start saving today!
Today, I briefly want to cover Apple. There are some excellent setups on the tech giant's stock chart further proof that my trading methods can be applied to equities as well as macro markets.
In my postof 10 July (I've spotted a problem facing four stock market darlings), I noted that Apple had very probablytopped off a large five wave pattern, and was in the process of turning down. On the chart I showed, my tramlines were excellent, and had all the features I like to see multiple accurate touch points and a prior pivot point (PPP) on at least one tramline:
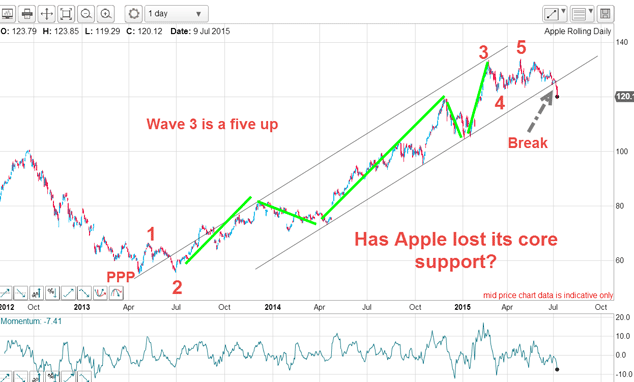
Not only that, but the entire rally off the 2013 low is a classic five-up with wave 3 containing its own five-wave impulse pattern (in green).
MoneyWeek
Subscribe to MoneyWeek today and get your first six magazine issues absolutely FREE

Sign up to Money Morning
Don't miss the latest investment and personal finances news, market analysis, plus money-saving tips with our free twice-daily newsletter
Don't miss the latest investment and personal finances news, market analysis, plus money-saving tips with our free twice-daily newsletter
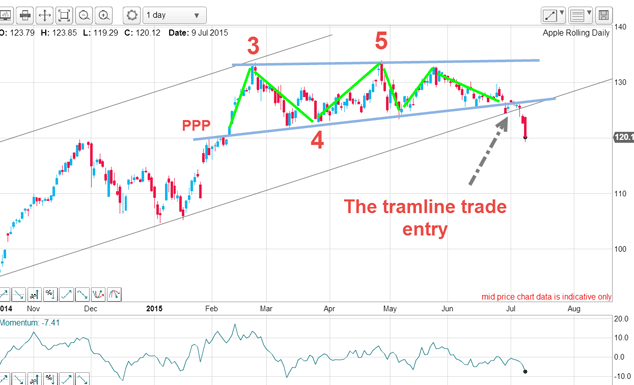
The day before I showed that chart, the market had broken the lower tramline. That was the first major signal that the trend had very probablyturned down. It was a warning to investors that the Apple story was likely to become less one-sidedly bullish.
On the close-up chart last month, I saw a wedge had formed at the highs, lending support to the idea that the trend was changing:
But there was one more surprise in store. The market attempted one more thrust up but was hit by heavy selling again at the 133 highs before peeling away very hard. This is the updated chart:
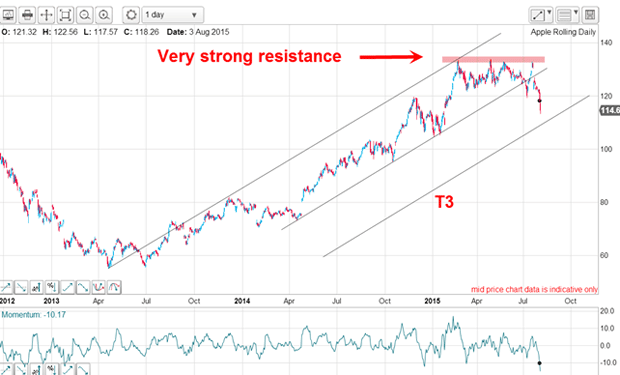
From that last hurrah, the market has been in virtual freefall. There was some support at the 120 level, but that was brushed aside and the market closed yesterday at the 114 level down about 15% off its 133 high. The next area of support is at T3, my third tramline (see the Dow chart later).
The severity of the decline and the wave count are not good omens for Apple investors.
Back to the Dow and a perfect trade setup
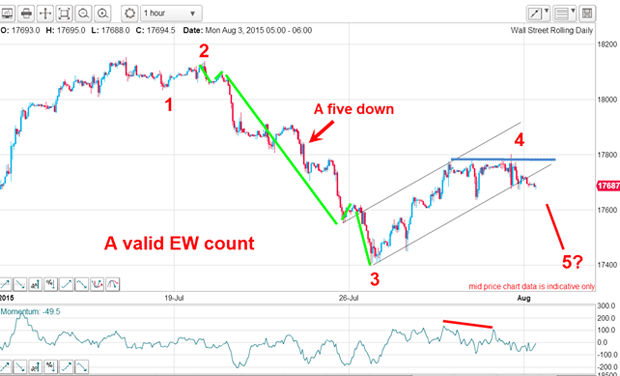
In fact, this 'five down three up' (or 'five up three down' in a bull market) is one of my favourite trade setups.
Sure enough, the market respected the initial tramline break, kissed the tramline and performed a 'scalded-cat bounce' down. That was confirmation the tramline was now a line of strong resistance. Then the market broke the first target T3, rallied around it in an A-B-C [pattern (in green) with the C wave kissing T3 and then broke down to T4, the second target. It is currently testing this support.
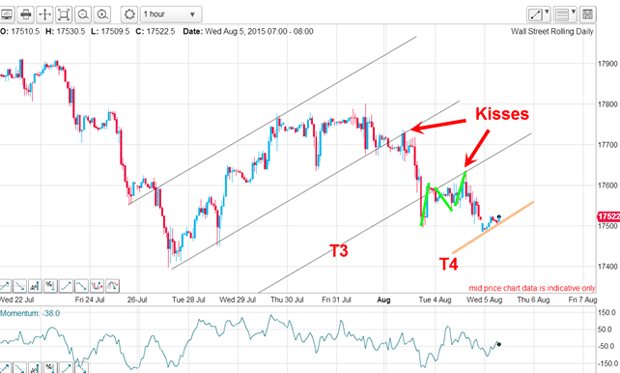
Once again, this market is demonstrating that my tramlines are important lines of support or resistance and can be used to set price targets where profits can be taken.
Get the latest financial news, insights and expert analysis from our award-winning MoneyWeek team, to help you understand what really matters when it comes to your finances.
John is is a British-born lapsed PhD physicist, who previously worked for Nasa on the Mars exploration team. He is a former commodity trading advisor with the US Commodities Futures Trading Commission, and worked in a boutique futures house in California in the 1980s.
He was a partner in one of the first futures newsletter advisory services, based in Washington DC, specialising in pork bellies and currencies. John is primarily a chart-reading trader, having cut his trading teeth in the days before PCs.
As well as his work in the financial world, he has launched, run and sold several 'real' businesses producing 'real' products.
-
 Average UK house price reaches £300,000 for first time, Halifax says
While the average house price has topped £300k, regional disparities still remain, Halifax finds.
-
 Barings Emerging Europe trust bounces back from Russia woes
Barings Emerging Europe trust has added the Middle East and Africa to its mandate, delivering a strong recovery, says Max King