A historic turning point?
With the odds stacking up on the side of the bears, John C Burford looks at what would it take to really confirm the top of the Dow's four-year bull market.
Get the latest financial news, insights and expert analysis from our award-winning MoneyWeek team, to help you understand what really matters when it comes to your finances.
You are now subscribed
Your newsletter sign-up was successful
Want to add more newsletters?

Twice daily
MoneyWeek
Get the latest financial news, insights and expert analysis from our award-winning MoneyWeek team, to help you understand what really matters when it comes to your finances.

Four times a week
Look After My Bills
Sign up to our free money-saving newsletter, filled with the latest news and expert advice to help you find the best tips and deals for managing your bills. Start saving today!
I shall continue coverage of the stock markets today because we are at a potentially historic turning point, as I have outlined in previous posts.In my past article on the Dow last Friday, I noted the textbook five-wave sequence down off the 22 May 15,540 high and on Friday, the market was in relief rally mode.
I noted that on so many previous occasions, after a pull-back from an extended rally, the retracements are very often sharp and deep. This is what I wrote last Friday:
"Now back to the Dow so what needs to occur to change this picture of a major turn in the Dow? Recall that in many other previous dips, retracements have been steep in many cases, to the Fibonacci 76% level, and sometimes even beyond.
MoneyWeek
Subscribe to MoneyWeek today and get your first six magazine issues absolutely FREE

Sign up to Money Morning
Don't miss the latest investment and personal finances news, market analysis, plus money-saving tips with our free twice-daily newsletter
Don't miss the latest investment and personal finances news, market analysis, plus money-saving tips with our free twice-daily newsletter
With this history, it would not be out of the question to expect a similar steep retrace here even to the 15,500 region. This possibility must be kept in mind. But if we do not see a steep retrace, that would be a very bearish sign, I believe."
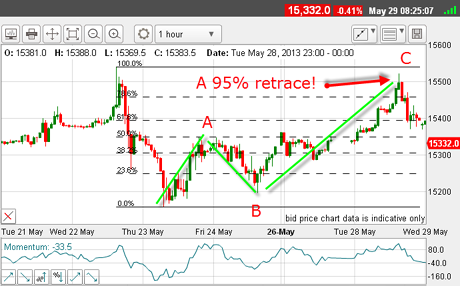
And since Friday, the retracement has certainly been steep and has exceeded the Fibonacci 76% level!
(Click on the chart to see a larger version)
The rally to 15,522 yesterday took it to a 95% retracement and I call that steep and deep!
Although the retrace was very deep, my Elliott wave labels are still valid, with five down and now three up. The crucial point is that 15,540 high was not exceeded.
The C wave is extended, but the relief rally remains a clear A-B-C.
If the 15,540 high holds,I think there could besome very large down moves ahead.
OK, but what do some of the other stock indexes tell us at this critical juncture? After all, if the Dow is turning many other major indexes should turn in synch, as all stock markets are responding to waves of liquidity.
Critical days ahead
(Click on the chart to see a larger version)
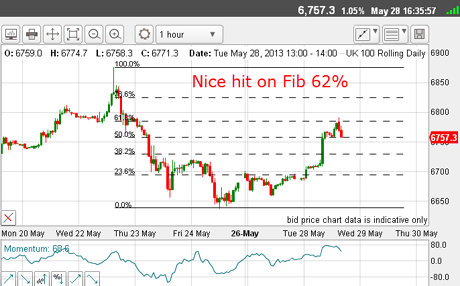
The rally only carried to the Fibonacci 62% level a far weaker performance than the Dow. And the Elliott wave pattern is similar five down and three up.
This certainly helps the bearish case.
But is there more?
Here is the Nasdaq:
(Click on the chart to see a larger version)
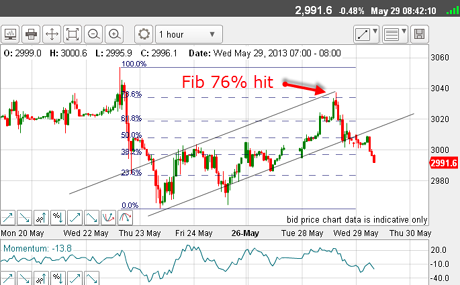
Again, we have a five down, three up sequence and the rally yesterday carried right to the Fibonacci 76% retrace.
Note my tramlines. The lower one has just been broken this morning.
The bearish case is getting stronger.
And finally, here is the S&P:
(Click on the chart to see a larger version)
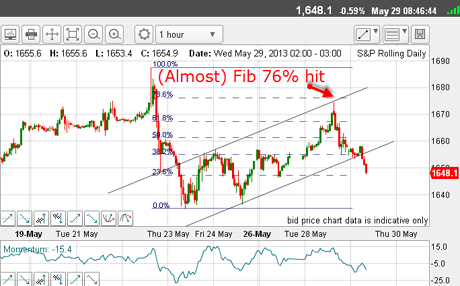
There was a near-miss on the Fibonacci 76% retrace, and a break of the lower tramline this morning.
The odds are now stacking up on the side of the bears. The Dow has had the deepest retrace of all. So, with all of this evidence, what would it take to really confirm the 22 May 15,540 high as the top of the four-year bull market?
For one thing, a move below the Thursday lows would indicate that we have a third wave on our hands, and this is my preferred scenario for the Dow in the short-term.
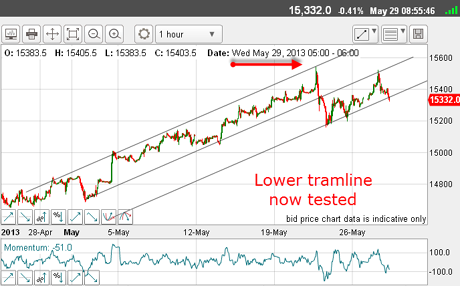
Here is my chart with my working tramlines updated from last week (the 15,540 high hit the upper tramline, marked by red arrow):
(Click on the chart to see a larger version)
As I write, the lower tramline is being tested, and if it gives way, it would set up my third wave down scenario.
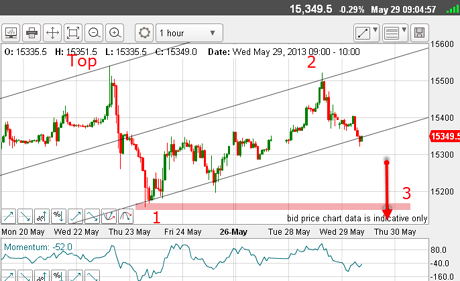
Here is my ideal picture:
(Click on the chart to see a larger version)
Last week's five down is a large wave 1. The rally to yesterday is wave 2 up, and we could be at the early stages of wave 3 down to below the 15,150 low (pink bar).
But first, I expect more work around this lower tramline. The next few days will be critical.
If you're a new reader, or need a reminder about some of the methods I refer to in my trades, then do have a look at my introductory videos:
The essentials of tramline trading Advanced tramline trading An introduction to Elliott wave theory Advanced trading with Elliott waves Trading with Fibonacci levels Trading with 'momentum' Putting it all together
Don't miss my next trading insight. To receive all my spread betting blog posts by email, as soon as I've written them, just sign up here . If you have any queries regarding MoneyWeek Trader, please contact us here.
Get the latest financial news, insights and expert analysis from our award-winning MoneyWeek team, to help you understand what really matters when it comes to your finances.
John is is a British-born lapsed PhD physicist, who previously worked for Nasa on the Mars exploration team. He is a former commodity trading advisor with the US Commodities Futures Trading Commission, and worked in a boutique futures house in California in the 1980s.
He was a partner in one of the first futures newsletter advisory services, based in Washington DC, specialising in pork bellies and currencies. John is primarily a chart-reading trader, having cut his trading teeth in the days before PCs.
As well as his work in the financial world, he has launched, run and sold several 'real' businesses producing 'real' products.
-
 Average UK house price reaches £300,000 for first time, Halifax says
While the average house price has topped £300k, regional disparities still remain, Halifax finds.
-
 Barings Emerging Europe trust bounces back from Russia woes
Barings Emerging Europe trust has added the Middle East and Africa to its mandate, delivering a strong recovery, says Max King