Has the Dow really turned?
After reaching a top, the Dow Jones began a huge sell-off. John C Burford looks at the charts to see if the Dow really has turned.
Get the latest financial news, insights and expert analysis from our award-winning MoneyWeek team, to help you understand what really matters when it comes to your finances.
You are now subscribed
Your newsletter sign-up was successful
Want to add more newsletters?

Twice daily
MoneyWeek
Get the latest financial news, insights and expert analysis from our award-winning MoneyWeek team, to help you understand what really matters when it comes to your finances.

Four times a week
Look After My Bills
Sign up to our free money-saving newsletter, filled with the latest news and expert advice to help you find the best tips and deals for managing your bills. Start saving today!
I will cover the Dow again today simply because it appears I have found a top, and because my trading methods have put me short.
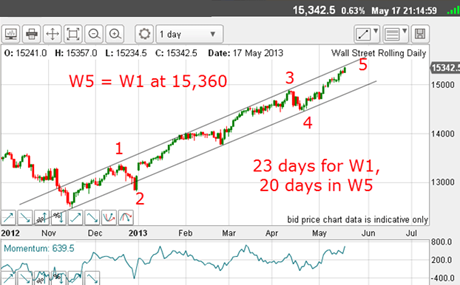
Recall that I had a top pencilled in for Wednesday, based upon the time equality of waves 1 and 5 on the short-term scale. I noted this last Friday, well ahead of the actual event:
(Click on the chart for a larger version)
MoneyWeek
Subscribe to MoneyWeek today and get your first six magazine issues absolutely FREE

Sign up to Money Morning
Don't miss the latest investment and personal finances news, market analysis, plus money-saving tips with our free twice-daily newsletter
Don't miss the latest investment and personal finances news, market analysis, plus money-saving tips with our free twice-daily newsletter
My tramline target was 15,360 on this tramline set with the top most likely arriving on Wednesday, which put wave 5 having the same 23 days duration as wave 1.
So, on Wednesday, the market poked higher on Bernanke's promise to keep the punch bowl topped up with funny money, but then a huge sell-off from the 15,540 high began. That wasn't in the Fed script!
How I found my top
(Click on the chart for a larger version)
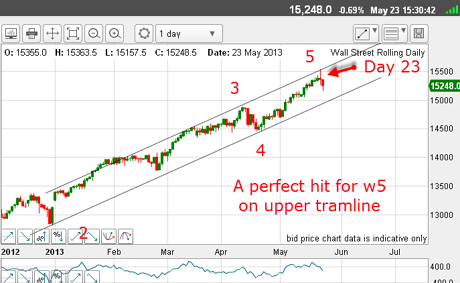
Aha! With these new tramlines, I now have my perfect hit on the upper line and on Day 23.
This, then, is a terrific candidate for the top.
But what evidence do I need to see before I can put more confidence in this?
On Wednesday, I wrote:
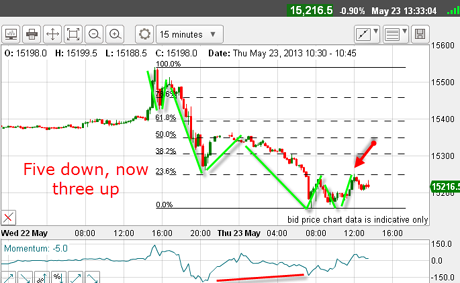
"OK, if we do have a turn at hand, what are the other signs that it is a genuine turn? Using Elliott waves again, a signal I will be watching for is a 5-wave sequence down on a small scale with all of the correct characteristics, such as a long and strong third wave and a positive momentum divergence at the fifth wave low."
So let's see if there is any such evidence after the Wednesday top. Here is a 15-minute chart I took yesterday morning:
(Click on the chart for a larger version)
Do I have a five-wave sequence down? Check. Is the third wave long and strong? Check. Do I see a positive momentum divergence at the fifth wave low? Check. Are we building a corrective wave sequence after the wave 5 low? Check. Has my short-term danger zones (see chart below) given way? Check.
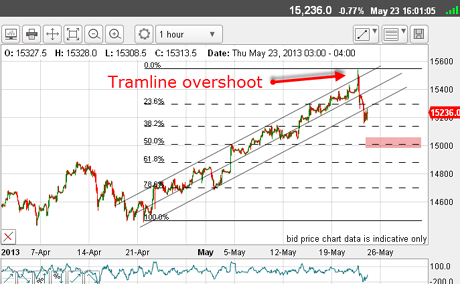
Here is the updated hourly chart from Wednesday as of yesterday afternoon:
(Click on the chart for a larger version)
Note the spike tramline overshoot to the 15,540 high. An overshoot after a long trend often heralds a reversal of some magnitude.
And my danger zones have been penetrated. That gave me the opportunity to position short as the tramlines were being broken.
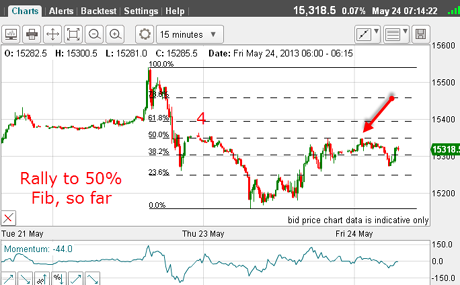
OK, so far, so good. But now we are in a relief rally, what can I expect? Here is the 15-minute chart as of this morning:
(Click on the chart for a larger version)
The relief rally has carried to the 50% Fibonacci retrace a normal stopping point. Also, this is where the previous wave 4 high is located.
In Elliott wave theory, a move to the previous wave 4 area is very common for the retrace.
So now I have two pointers to believe the bull market has probably ended.
But in the markets, there is never 100% certainty, and the rally could extend further. In fact, the market could go on to make new highs, if it so chooses.
In trading, we are dealing with probabilities, and as of this morning, the odds are coming down a little more on the side of a turn here.
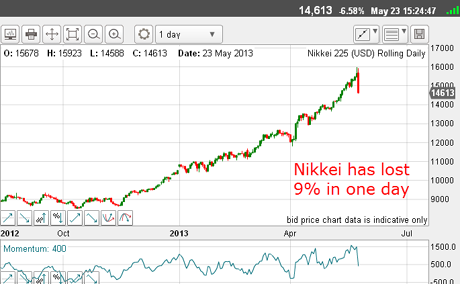
But if you think the Dow has made that turn, have a glance at the Nikkei:
(Click on the chart for a larger version)
As with the USD/JPY trade, the Nikkei has become a very crowded trade. I have a feeling it is becoming far less crowded.
The Nikkei had assumed a parabolic curve, and we all know how these pan out.
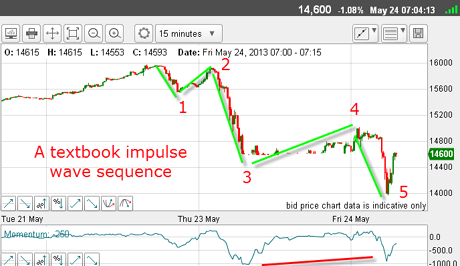
And when we look inside this decline, we find a textbook five-wave sequence, complete with a long and strong third wave and a positive momentum divergence at the fifth wave low, as in the Dow:
(Click on the chart for a larger version)
The third wave low was created by the automatic suspension of trading when the daily limit had been reached. That is heavy selling!
Now we have this impulse wave, an upward correction is the likely next move, as in the Dow.
Incidentally, wave 5 may not be complete to the downside! But as I write, this is my best guess. But if trading from the short side, it doesn't really matter, as rallies are there to be shorted into.
As stated above, a common stopping point for the relief rally is in the region of the wave 4 high, and we about there this morning.
My ideal Dow scenario
With this history, it would not be out of the question to expect a similar steep retracement here even to the 15,500 region. This possibility must be kept in mind. But if we do not see a steep retracement, that would be a very bearish sign, I believe.
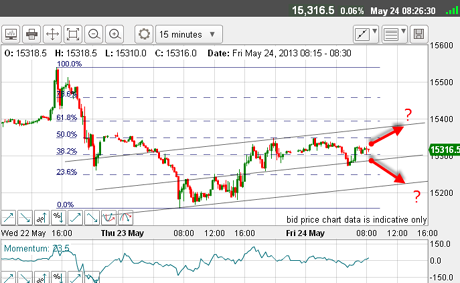
With the relief rally having carved out an informative chart pattern, I am able to draw in some very interesting tramlines:
(Click on the chart for a larger version)
The market has satisfied the minimum for a complete retracement, but as I see it, it has two immediate options. It could rally further to a meeting of the upper tramline and the Fibonacci 62% level. Or it could break below the centre tramline and head for the lower one.
If it takes the second option, the odds would be on for a test of the wave 5 low, and I could then suggest this Elliott wave labelling with more confidence:
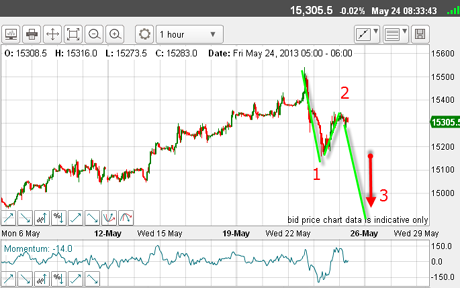
(Click on the chart for a larger version)
That would put my next target at the 15,000 area, or lower. This is my ideal scenario.
I have a feeling the waves being created this week will go into my next textbook as classic examples of how to use Elliott waves in trading, using only its very basic concepts. Remember, Elliott waves can give a pretty accurate picture of what to expect over the next period a priceless advantage for any trader.
It is well worth getting to grips with Elliott wave theory!
If you're a new reader, or need a reminder about some of the methods I refer to in my trades, then do have a look at my introductory videos:
The essentials of tramline trading Advanced tramline trading An introduction to Elliott wave theory Advanced trading with Elliott waves Trading with Fibonacci levels Trading with 'momentum' Putting it all together
Don't miss my next trading insight. To receive all my spread betting blog posts by email, as soon as I've written them, just sign up here . If you have any queries regarding MoneyWeek Trader, please contact us here.
Get the latest financial news, insights and expert analysis from our award-winning MoneyWeek team, to help you understand what really matters when it comes to your finances.
John is is a British-born lapsed PhD physicist, who previously worked for Nasa on the Mars exploration team. He is a former commodity trading advisor with the US Commodities Futures Trading Commission, and worked in a boutique futures house in California in the 1980s.
He was a partner in one of the first futures newsletter advisory services, based in Washington DC, specialising in pork bellies and currencies. John is primarily a chart-reading trader, having cut his trading teeth in the days before PCs.
As well as his work in the financial world, he has launched, run and sold several 'real' businesses producing 'real' products.
-
 Average UK house price reaches £300,000 for first time, Halifax says
While the average house price has topped £300k, regional disparities still remain, Halifax finds.
-
 Barings Emerging Europe trust bounces back from Russia woes
Barings Emerging Europe trust has added the Middle East and Africa to its mandate, delivering a strong recovery, says Max King