A counter-trend rally could mean quick profits in gold
Gold has been in a downtrend for some time, but could a rally be about to catch traders unawares? John C Burford examines the charts.
Get the latest financial news, insights and expert analysis from our award-winning MoneyWeek team, to help you understand what really matters when it comes to your finances.
You are now subscribed
Your newsletter sign-up was successful
Want to add more newsletters?

Twice daily
MoneyWeek
Get the latest financial news, insights and expert analysis from our award-winning MoneyWeek team, to help you understand what really matters when it comes to your finances.

Four times a week
Look After My Bills
Sign up to our free money-saving newsletter, filled with the latest news and expert advice to help you find the best tips and deals for managing your bills. Start saving today!
It has been a while since I last covered gold and that was because most of the market action was concentrated in the stockmarkets. But today, it is gold's turn and I want to show several notable chart patterns.
In my last poston gold on 7 December, gold had just hit the $1,050 area, which I noted was an area of major long-term support, because it is at the Fibonacci 50% retrace of the bull run from the 'Brown low' in 2002 to the all-time high in 2011.
Any time a market makes a Fibonacci 50% correction to a major wave, that is a notable event and cautions traders to expect at least a pause in the current trend. This guideline applies in all time scales and I use it constantly on my favourite short-term time scale, the hourly charts.
MoneyWeek
Subscribe to MoneyWeek today and get your first six magazine issues absolutely FREE

Sign up to Money Morning
Don't miss the latest investment and personal finances news, market analysis, plus money-saving tips with our free twice-daily newsletter
Don't miss the latest investment and personal finances news, market analysis, plus money-saving tips with our free twice-daily newsletter
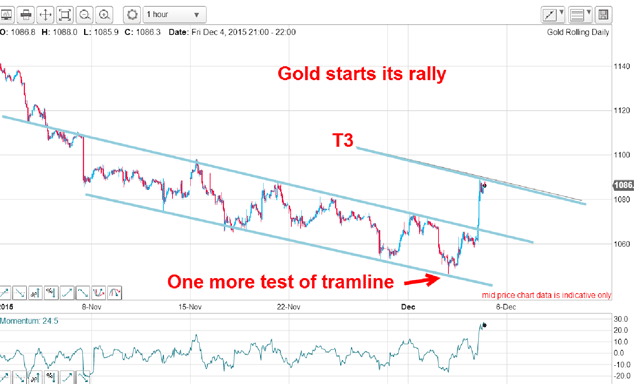
So what has been the market moves since then? This was my hourly chart posed in December:

I had a superb tramline pair working and the explosive rally in early December had hit my T3 target. That was an excellent place to take at least partial profits on trades taken on the upper tramline break.
But in December, there was no follow-through and the market eased back to test the $1,050 low again.
That was the time to sit and wait for another clear signal. Sometimes, it pays to stand aside and observe.
But early this month, the market woke up and started to edge back up. Recall that in December, bullish sentiment was very low and that was one reason I expected a rally phase to begin at any time.
Here is the Commitments of traders (COT) data I showed in December:
| (Contracts of troy ounces) | Row 0 - Cell 1 | Row 0 - Cell 2 | Row 0 - Cell 3 | Open interest: 536,215 | ||||
| Commitments | ||||||||
| 160,479 | 147,438 | 118,844 | 218,055 | 225,105 | 497,378 | 491,388 | 38,837 | 44,828 |
| Changes from 11/24/15 (Change in open interest: 806) | ||||||||
| -1,613 | 5,590 | 2,263 | 3,163 | -6,370 | 3,813 | 1,483 | -3,008 | -677 |
| Percent of open in terest for each category of traders | ||||||||
| 29.9 | 27.5 | 22.2 | 40.7 | 42.0 | 92.8 | 91.6 | 7.2 | 8.4 |
| Number of traders in each category (Total traders: 343) | ||||||||
| 139 | 134 | 118 | 53 | 54 | 255 | 250 | Row 8 - Cell 7 | Row 8 - Cell 8 |
Unusually, hedge funds (the non-commercials) were holding almost as many short futures as long, with the small speculators holding a plurality of shorts. This extreme bearishness led me to believe a sharp rally could not be far off.
So what is the position today? Here is the latest COT data:
| (Contracts of troy ounces) | Row 0 - Cell 1 | Row 0 - Cell 2 | Row 0 - Cell 3 | Open interest: 551,508 | ||||
| Commitments | ||||||||
| 160,944 | 112,697 | 143,482 | 205,805 | 253,064 | 510,231 | 509,243 | 41,277 | 42,265 |
| Changes from 01/05/16 (Change in open interest: -1,139) | ||||||||
| 6,180 | -11,480 | -11,248 | -188 | 23,250 | -5,257 | 522 | 4,117 | -1,662 |
| Percent of open in terest for each category of traders | ||||||||
| 29.2 | 20.4 | 26.0 | 37.3 | 45.9 | 92.5 | 92.3 | 7.5 | 7.7 |
| Number of traders in each category (Total traders: 361) | ||||||||
| 162 | 120 | 127 | 58 | 60 | 273 | 262 | Row 8 - Cell 7 | Row 8 - Cell 8 |
Now, the hedgies have switched to a more bullish stance. In fact last week, they moved sharply to the bull's camp with a move of over 10%.
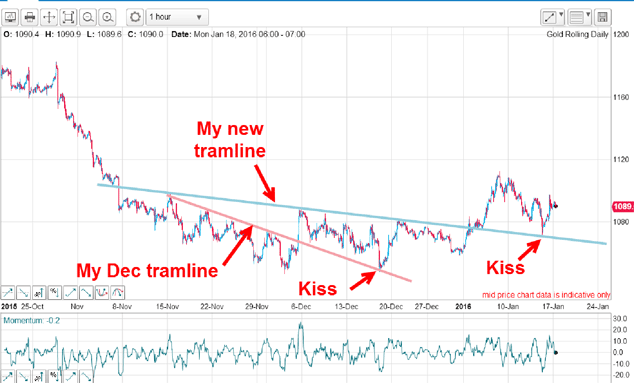
So did the price follow? Here is the latest hourly chart:

My December tramline (in pink) was genuine and that was demonstrated by the pull-back to the kiss on 17 December. That support held and the market moved up sharply from it in a classic scalded-cat bounce.
That was a signal the market wanted to move higher and a long trade was indicated.
But there was no sharp rally until the market started its move in the first week of January. It was then that I could draw in another tramline (blue). It has a nice prior pivot point (PPP) in early November and at least four accurate touch points. When the market broke above it in the first few days of this month, it was confirmed as a new line of support (it was resistance before the break).
And when the market pulled back last week, it planted another kiss and moved sharply up and away in another scalded-cat bounce. Isn't that pretty? This kind of action usually signals that a trend reversal is at hand.
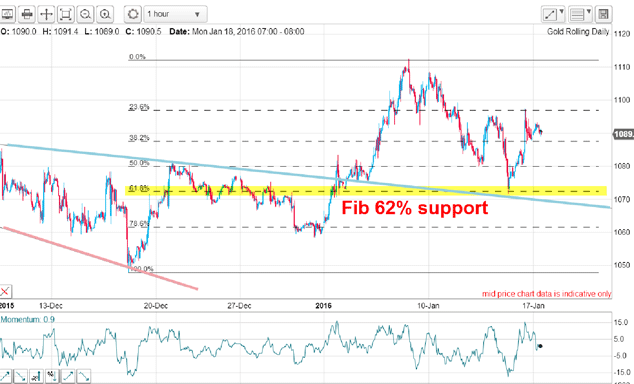
Not only did the latest kiss mark a short term low at the $1,072 level, it was also an important Fibonacci support level:

Not only is the $1,072 level is where the market kisses the tramline support, but it is also at the Fibonacci 62% support level a powerful combination, and an ideal place to enter a low-risk trade.
Of course, preparing your charts in this way with the Fibonacci levels and tramlines already marked out gives the nimble trader opportunities to enter orders (and protective stops) ahead of time.
This policy avoids the frustrating habit of the gold market to spike to your target and stay there for only a few moments before zooming away. If you are not at your screen then, you miss the best price and you necessarily must use a wider stop. This cancels out the advantage of your careful analysis!
With gold trading this morning at the $1,090 level $40 above the $1,050 low is it set for that explosive rally?
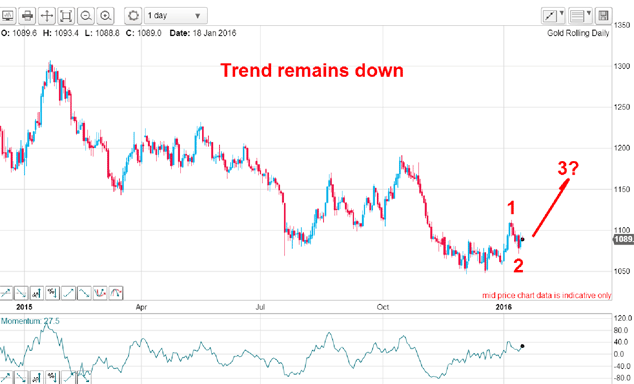
Here is the daily chart:

So far, the $1,050 level is holding and the waves up could be the start of a five up with the latest kiss on the $1,072 level my wave 2 low.
But to confirm, I need to see a move above the recent wave 1 high and that level at $1,112 is my key. If the market cannot move above that fairly soon, the downtrend should resume.
Interestingly, stockmarkets are in rally mode this morning, and the relief rallies I have been expecting (see Friday's post) may be starting. I expect to cover them on Wednesday. Tune in then.
Get the latest financial news, insights and expert analysis from our award-winning MoneyWeek team, to help you understand what really matters when it comes to your finances.
John is is a British-born lapsed PhD physicist, who previously worked for Nasa on the Mars exploration team. He is a former commodity trading advisor with the US Commodities Futures Trading Commission, and worked in a boutique futures house in California in the 1980s.
He was a partner in one of the first futures newsletter advisory services, based in Washington DC, specialising in pork bellies and currencies. John is primarily a chart-reading trader, having cut his trading teeth in the days before PCs.
As well as his work in the financial world, he has launched, run and sold several 'real' businesses producing 'real' products.
-
 Average UK house price reaches £300,000 for first time, Halifax says
While the average house price has topped £300k, regional disparities still remain, Halifax finds.
-
 Barings Emerging Europe trust bounces back from Russia woes
Barings Emerging Europe trust has added the Middle East and Africa to its mandate, delivering a strong recovery, says Max King