Bad data is driving fear of a second wave of Covid-19
The recent spike in Covid-19 “cases” is very different to the original outbreak, says James Ferguson of MacroStrategy Partnership. The government needs to calm down.

Get the latest financial news, insights and expert analysis from our award-winning MoneyWeek team, to help you understand what really matters when it comes to your finances.
You are now subscribed
Your newsletter sign-up was successful
Want to add more newsletters?

Twice daily
MoneyWeek
Get the latest financial news, insights and expert analysis from our award-winning MoneyWeek team, to help you understand what really matters when it comes to your finances.

Four times a week
Look After My Bills
Sign up to our free money-saving newsletter, filled with the latest news and expert advice to help you find the best tips and deals for managing your bills. Start saving today!
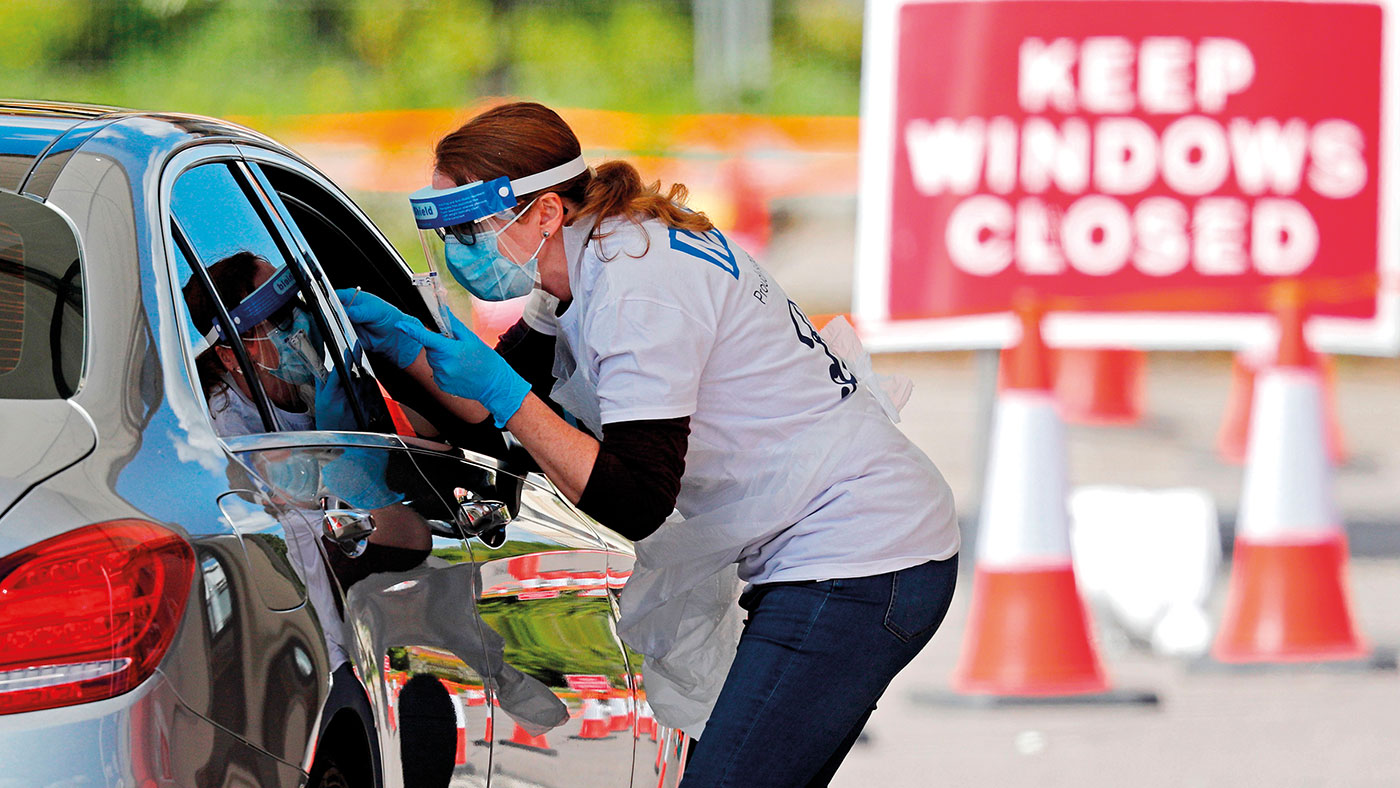
Covid-19 cases are on the rise again, particularly amongst the young. The “rule of six” is now nationwide. Localised lockdowns are in place up north. And even martial-law-style 10pm curfews are being considered. So-called “pillar 2” cases from the wider community – where “cases” are a misnomer for “positive” test results – have doubled in the last two weeks from about 2% to roughly 4%. Is this the long-awaited second wave? And once all these infected young northerners visit their grandfathers (ill, elderly men are particularly vulnerable), will it turn into an increase in deaths too?
This seems to be what our politicians fear – hence their aggressive response. However they are making some major mistakes. One is the policy direction itself – the correct response is not a lockdown of the general population, but shielding of the vulnerable. The other is in misinterpreting the data. “Positives” are not the same as “cases” (the latter require both symptoms and a doctor’s diagnosis).
This leads to a dilemma because, as you can see from the chart on page 23 (which runs to 12 September), although positives have leapt sevenfold from their June-July low, deaths over the same period have fallen by two thirds.
MoneyWeek
Subscribe to MoneyWeek today and get your first six magazine issues absolutely FREE

Sign up to Money Morning
Don't miss the latest investment and personal finances news, market analysis, plus money-saving tips with our free twice-daily newsletter
Don't miss the latest investment and personal finances news, market analysis, plus money-saving tips with our free twice-daily newsletter
The epidemiological rule-of-thumb is that the number of (unseen) infections will be roughly ten times the number of diagnosed cases, which in turn will be roughly ten times greater than the number of deaths. Working backwards from deaths, and taking account of the three-week period of illness, we would expect the UK to have about 2,500 diagnosed cases, of which half would be hospitalised (the government currently reports just 972 hospital patients). That would also suggest 25,000 current infections, or disease prevalence (ie, the percentage of the population who has it) of sub-0.04%.
Yet the pillar 2 community-testing scheme is now finding 4% positives. In other words, the test regime seems to be finding 100 times more positives than the combined data on diagnosed cases, hospital admissions and deaths would suggest. That begs the question: how many of these are false positives?
Why false positives really matter
It might surprise you to learn that a positive medical test result does not often – or even usually – mean that an asymptomatic patient has a disease. If the false positive rate (FPR) is the same as the prevalence of the disease, then half of all positives will be false. And the lower the prevalence compared to the FPR, the more inaccurate the results will be. Even doctors don’t tend to grasp the full implications of that.
In 1982, a researcher called David Eddy provided physicians with a diagnostic puzzle. Women age 40, participate in routine screening for breast cancer, with a prevalence of 1%. The mammogram test has a false negative rate of 20% and an FPR of 10%. What is the probability that a woman with a positive test has breast cancer? The correct answer is just 7.5%.
In each batch of 100,000 tests, 800 cases (80% of the 1,000 women who actually have breast cancer) will be picked up. But so too will 9,920 (10% FPR) of the 99,200 healthy women. So the chance of having breast cancer if you test positive is still only 7.46% (800/10,720). However, 95 out of 100 doctors gave answers in the range of 70-80%, ten times higher than the correct answer.
Not a whole lot has changed since that study.
To read the whole of this article, subscribe to MoneyWeek magazine
Subscribers can see the whole article in the digital edition available here
Get the latest financial news, insights and expert analysis from our award-winning MoneyWeek team, to help you understand what really matters when it comes to your finances.
James Ferguson qualified with an MA (Hons) in economics from Edinburgh University in 1985. For the last 21 years he has had a high-powered career in institutional stock broking, specialising in equities, working for Nomura, Robert Fleming, SBC Warburg, Dresdner Kleinwort Wasserstein and Mitsubishi Securities.
-
 Average UK house price reaches £300,000 for first time, Halifax says
While the average house price has topped £300k, regional disparities still remain, Halifax finds.
-
 Barings Emerging Europe trust bounces back from Russia woes
Barings Emerging Europe trust has added the Middle East and Africa to its mandate, delivering a strong recovery, says Max King
-
 How a dovish Federal Reserve could affect you
Trump’s pick for the US Federal Reserve is not so much of a yes-man as his rival, but interest rates will still come down quickly, says Cris Sholto Heaton
-
 New Federal Reserve chair Kevin Warsh has his work cut out
Opinion Kevin Warsh must make it clear that he, not Trump, is in charge at the Fed. If he doesn't, the US dollar and Treasury bills sell-off will start all over again
-
 How Canada's Mark Carney is taking on Donald Trump
Canada has been in Donald Trump’s crosshairs ever since he took power and, under PM Mark Carney, is seeking strategies to cope and thrive. How’s he doing?
-
 Rachel Reeves is rediscovering the Laffer curve
Opinion If you keep raising taxes, at some point, you start to bring in less revenue. Rachel Reeves has shown the way, says Matthew Lynn
-
 The enshittification of the internet and what it means for us
Why do transformative digital technologies start out as useful tools but then gradually get worse and worse? There is a reason for it – but is there a way out?
-
 What turns a stock market crash into a financial crisis?
Opinion Professor Linda Yueh's popular book on major stock market crashes misses key lessons, says Max King
-
 ISA reforms will destroy the last relic of the Thatcher era
Opinion With the ISA under attack, the Labour government has now started to destroy the last relic of the Thatcher era, returning the economy to the dysfunctional 1970s
-
 Why does Trump want Greenland?
The US wants to annex Greenland as it increasingly sees the world in terms of 19th-century Great Power politics and wants to secure crucial national interests