Get the latest financial news, insights and expert analysis from our award-winning MoneyWeek team, to help you understand what really matters when it comes to your finances.
You are now subscribed
Your newsletter sign-up was successful
Want to add more newsletters?

Twice daily
MoneyWeek
Get the latest financial news, insights and expert analysis from our award-winning MoneyWeek team, to help you understand what really matters when it comes to your finances.

Four times a week
Look After My Bills
Sign up to our free money-saving newsletter, filled with the latest news and expert advice to help you find the best tips and deals for managing your bills. Start saving today!
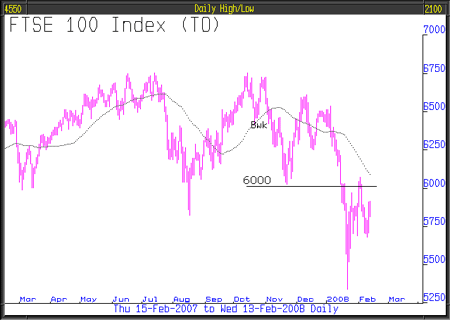
The FTSE 100 remains below the key level referred to in the previous issue, number 563, of 6000. It remains our view, that from a purely technical standpoint, that below 6000 this bear market remains undoubted. A similar key level for the Dow Jones Industrial Average is 13000.
It remains the case that significant tops have formed in virtually every stock market in the world - a condition that is most unusual and very ominous for 2008. (See charts below)
In this year's first issue, number 561, dated 3rd January 2008 we touched upon the January barometer "How goes January, so goes the rest of the year" it might just work this time. In January the stock markets worldwide were grim, particularly emerging markets. FCAM's managed portfolios continue to benefit from these conditions and whilst stock markets worldwide were delivering bleak returns in January, the model portfolio enjoyed an increase of approximately 4.5%.
MoneyWeek
Subscribe to MoneyWeek today and get your first six magazine issues absolutely FREE

Sign up to Money Morning
Don't miss the latest investment and personal finances news, market analysis, plus money-saving tips with our free twice-daily newsletter
Don't miss the latest investment and personal finances news, market analysis, plus money-saving tips with our free twice-daily newsletter
The optimists, George Bush included, continue to say that the US economy will not slide into recession. However other analysts are saying that the US economy is already in recession and recent economic news is indicative of that. It was reported that in January, non farm payrolls fell by 17,000, economists were forecasting an increase of 70,000; it was the first decline in US job creation since 2003. According to Bloomberg, not one analyst that they had polled forecast a negative number.
This unexpectedly bad number was shortly followed by further shocking news, the Institute for Supply Management's Index of Activity in the US service sector in January fell to 41.9 compared to 54.4 in December (below 50 represents contraction), the lowest number since October 2001. Given that the US economy, like the UK economy, is predominantly service sector based, a worse number could not have been imagined.
History tells us that whenever the US suffers a recession it causes a sharp fall globally in corporate earnings, with a minimum of 20% to 30% falls in non US stock markets. So far, falls have been 15%, suggesting that further weakness is yet to come.
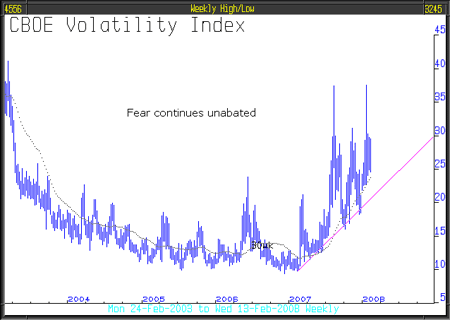
Although stock markets at the time of writing are not in plunge mode, the VIX index, which measures fear and concern in the market, as can be seen by the chart, remains elevated.

As we never fail to say, the global economy is in the grip of a credit contraction. That credit contraction is, as Martin Wolf in the Financial Times recently said, the economy's way of telling us that the era of unsustainable growth is over.
A recent Federal Reserve survey of senior lending officers showed a sharp contraction in banks' willingness to lend to either businesses or individuals. Another recent survey conducted by the European Central Bank shows significant tightening with banks expecting further contraction this quarter.
Economic conditions could not be less friendly to most asset classes, something that will continue for a long while yet and should have the last word as far as the direction of stock markets in 2008 which we expect to head much lower than is now the case.
By John Robson & Andrew Selsby at fullCircle Asset Management, as published in the threesixty Newsletter, a fortnightly newsletter that gives insight into the investment markets.
Major stock markets form tops

Get the latest financial news, insights and expert analysis from our award-winning MoneyWeek team, to help you understand what really matters when it comes to your finances.
MoneyWeek is written by a team of experienced and award-winning journalists, plus expert columnists. As well as daily digital news and features, MoneyWeek also publishes a weekly magazine, covering investing and personal finance. From share tips, pensions, gold to practical investment tips - we provide a round-up to help you make money and keep it.
-
 MoneyWeek Talks: The funds to choose in 2026
Podcast Fidelity's Tom Stevenson reveals his top three funds for 2026 for your ISA or self-invested personal pension
-
 Three companies with deep economic moats to buy now
Opinion An economic moat can underpin a company's future returns. Here, Imran Sattar, portfolio manager at Edinburgh Investment Trust, selects three stocks to buy now

