The charts that matter: a quandary for the Fed
The yield curve is putting pressure on the Federal reserve to cut interest rates. But the economic data doesn't support that. John Stepek looks at what the charts that matter most to the global economy are saying this week.

Get the latest financial news, insights and expert analysis from our award-winning MoneyWeek team, to help you understand what really matters when it comes to your finances.
You are now subscribed
Your newsletter sign-up was successful
Want to add more newsletters?

Twice daily
MoneyWeek
Get the latest financial news, insights and expert analysis from our award-winning MoneyWeek team, to help you understand what really matters when it comes to your finances.

Four times a week
Look After My Bills
Sign up to our free money-saving newsletter, filled with the latest news and expert advice to help you find the best tips and deals for managing your bills. Start saving today!
Welcome back.
Unbelievably, Merryn and I have managed to record a podcast for the third week in a row. This uncharacteristic lapse into consistency will no doubt be rectified soon, but in the meantime, have a listen to us talk about currency wars, Poor Neil Woodford, and plans for a new stock exchange in Scotland. Also, if you can think of a topic that might put a smile on my grimly cynical face, then Merryn wants to hear about it.
Actually, thinking about it, something that would put a smile on my otherwise dour visage is if you were to buy a copy of my book, The Sceptical Investor, and tell me what you think of it (fulsome praise is always appreciated, but I'll also grudgingly accept constructive criticism). It's available in all types of formats here.
MoneyWeek
Subscribe to MoneyWeek today and get your first six magazine issues absolutely FREE

Sign up to Money Morning
Don't miss the latest investment and personal finances news, market analysis, plus money-saving tips with our free twice-daily newsletter
Don't miss the latest investment and personal finances news, market analysis, plus money-saving tips with our free twice-daily newsletter
Or you could always come up and talk to me about it at the MoneyWeek Wealth Summit on 22 November we'd love to see you there you can get your early bird tickets here.
If you missed any of this week's Money Mornings, here are the links you need:
Monday: Forget the trade truce here's what really matters for markets now
Tuesday: Woodford's fund stays shut but it is time to buy Patient Capital
Wednesday: Bitcoin is back in a bear market but don't sell now
Thursday: Get ready for epic levels of monetary debasement
Friday: UK house prices continue their long, slow drift lower
Currency Corner: the Australian dollar's dreadful decade
Subscribe: Get your first six issues of MoneyWeek free here
Don't miss Merryn's blogs this week on how to do debt forgiveness properly (give us all money!), and on why a Jeremy Corbyn government is a much bigger worry than Brexit.
Now, to the charts.
The chart below shows the yield curve that is, the difference (the "spread") between what it costs the US government to borrow money over ten years and what it costs over two. Once this number turns negative, the yield curve has inverted, which almost always signals a recession (although perhaps not for up to two years).
The curve between the three month and the ten year is still inverted, while the two-year and ten-year is not. But the gap between the latter two slid hard this week, as you can see in the chart below.
That's partly because interest rates are tumbling across the globe in the expectation of lower interest rates. But the yield curve's strong record as a recession indicator puts even more pressure on the Federal Reserve to prevent it from turning negative. Ironically, the most obvious way to do that is to cut rates aggressively (so that you drive short-term rates much lower than longer-term ones).
The tricky thing, though, is doing that if the economic data doesn't entirely justify it. The latest US non-farm payrolls data, released yesterday afternoon, will give the Fed a bit of a headache. Markets had expected a rate cut this month, and yet US employment is healthier than expected. Overall, I'd still be surprised if the Fed doesn't rush out to assure markets that a cut is coming, but it's going to be a tricky one to justify at this rate.
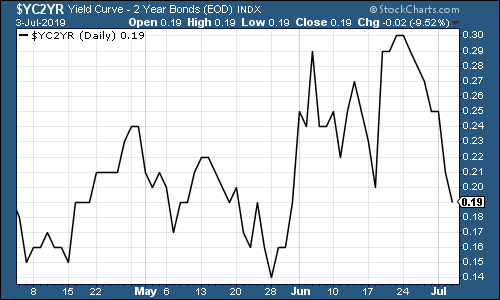
(The gap between the yield on the ten-year US Treasury and that on the two-year, going back three months)
Gold (measured in dollar terms) had a calmer week then fell on Friday afternoon as the dollar pushed higher off the back of the stronger-than-expected US jobs data.
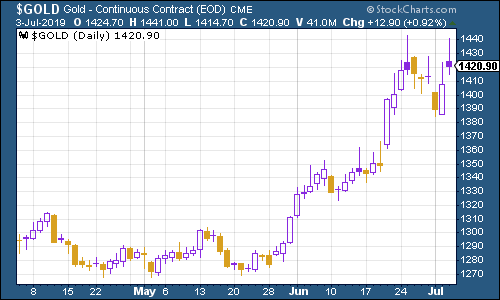
(Gold: three months)
The US dollar index a measure of the strength of the dollar against a basket of the currencies of its major trading partners rebounded somewhat this week (helped by the euro weakening on the news that Christine Lagarde, viewed as a "dove", is set to take over as European Central Bank head from Mario Draghi) then strengthened again as the US jobs data beat expectations.
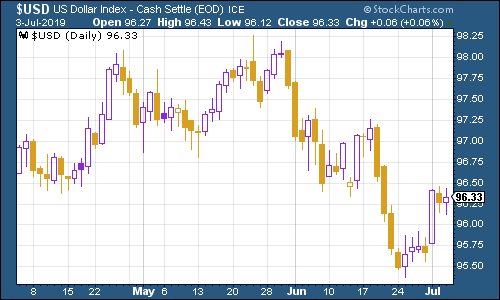
(DXY: three months)
The weaker dollar means that the number of yuan (or renminbi) to the US dollar (USDCNY) remains comfortably below the critical 7.0 level that would suggest China might be on the verge of devaluing its currency, which would be deflationary. However, the dollar needs to remain weak or the yuan could well threaten the 7 level again.
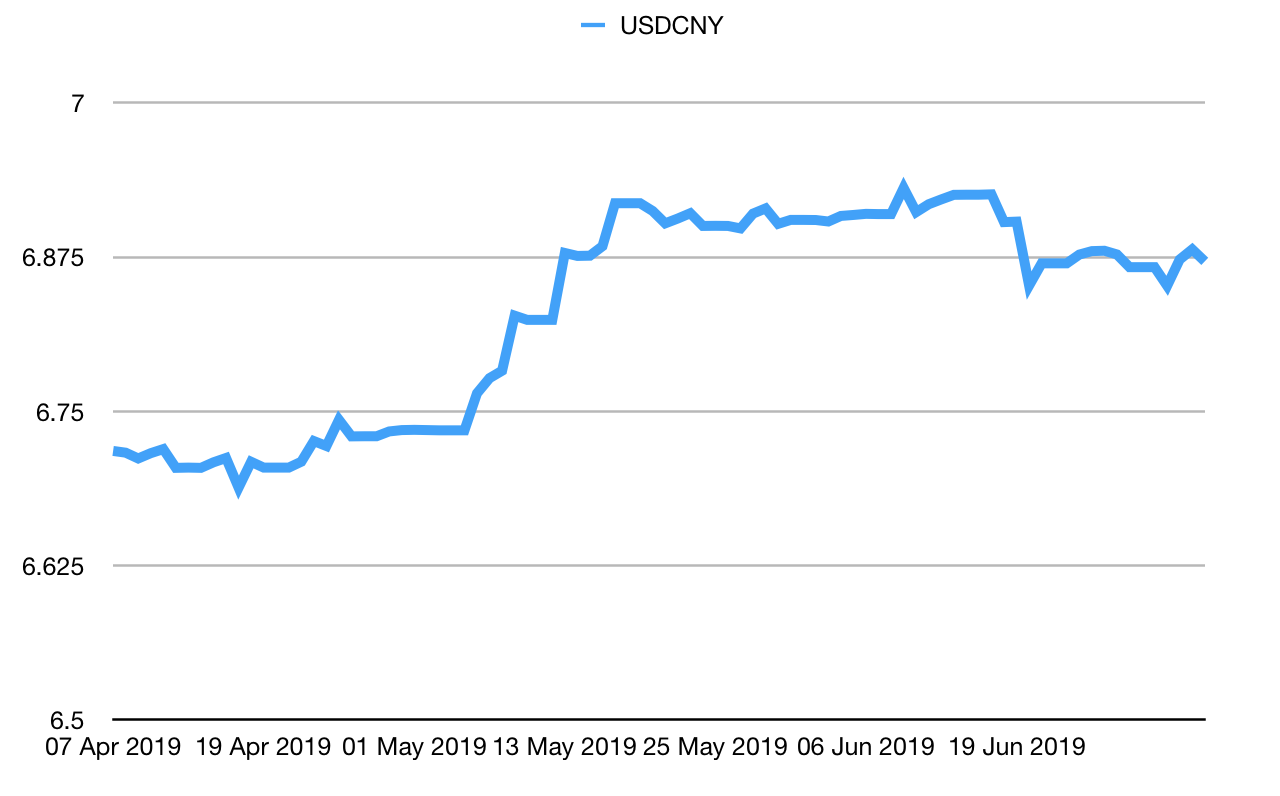
(Chinese yuan to the US dollar: three months)
Ten-year yields on major developed-market bonds slid further and faster this week. The US is now able to borrow over ten years in exchange for less than 2% a year in interest. That's lower than the current inflation rate, so anyone who takes the US up on this offer and wants to make a profit from it, is betting purely on making their money by selling this bond to someone else at a higher price further down the line. Either that or they are scared stiff of rampant deflation, which just doesn't seem likely.
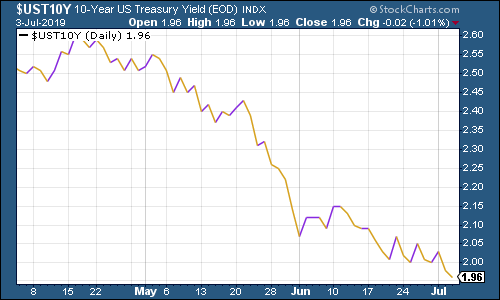
(Ten-year US Treasury yield: three months)
The thing is, lending to the US government looks like an absolute bargain compared to other nations. The UK can now borrow at less than 1% a year over ten years (versus CPI inflation sitting at around 2%).
Meanwhile Italy that bastion of fiscal prudence is currently being charged around 1.7% a year to borrow over a decade. That's astonishing, given that not only is Italy widely viewed as barely solvent, but that it's also using a currency whose very existence is threatened by yes, you guessed it! Italy's lack of solvency.
Mind you, at least with those countries you actually get an interest payment, even if it doesn't compensate you for inflation or credit risk. Lending money to Japan over ten years will now set you back the equivalent of about 15p for every £100 you lend it, as the chart below shows.
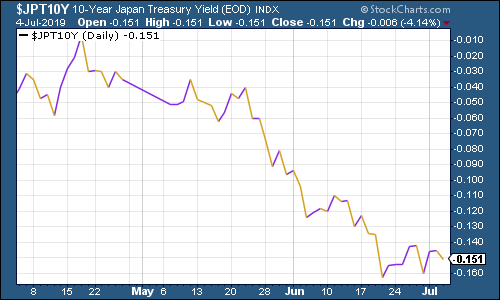
(Ten-year Japanese government bond yield: three months)
And Japan has nothing on Germany. Over there, you'll be paying nearly 40p a year for every £100 you agree to lend to the government.
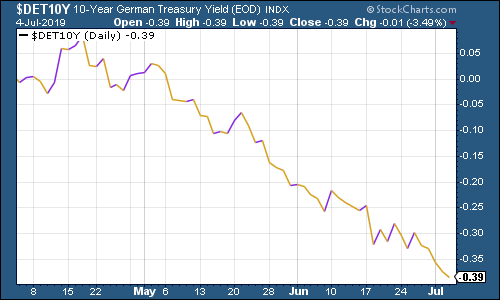
(Ten-year bund yield: three months)
Is this madness? I mean, there are all sorts of special circumstances I've written about why people invest in negative bonds many times before, and there's a twisted logic to it but overall, you have to wonder about the health of a global financial system in which this has become the norm.
No wonder our politics and our culture are full of conflict over fundamental values everything we took for granted about money and finance is also completely up in the air. (We touch on this in the podcast, though we should do more on it).
Copper was little changed this week. On the one hand, the weaker dollar has been propping it up. On the other, if the outlook for the global economy is as grim as bond markets appear to think, then copper demand is heading lower.
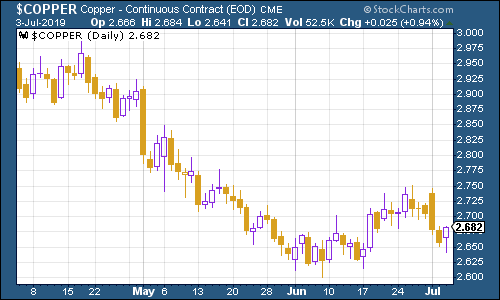
(Copper: three months)
The Aussie dollar made a decent recovery earlier this week, although Friday afternoon's jump in the US dollar dented it somewhat.
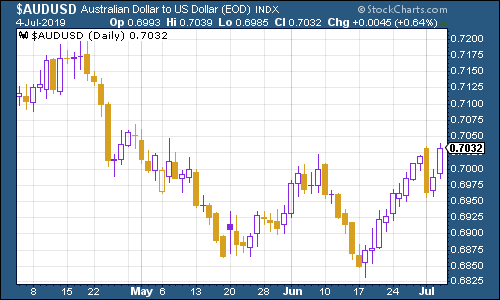
(Aussie dollar vs US dollar exchange rate: three months)
Cryptocurrency bitcoin settled into a bit of a groove after a very exciting week last week. Technically it's in a bear market but that doesn't really mean an awful lot in this particular space, as Dominic pointed out earlier this week.
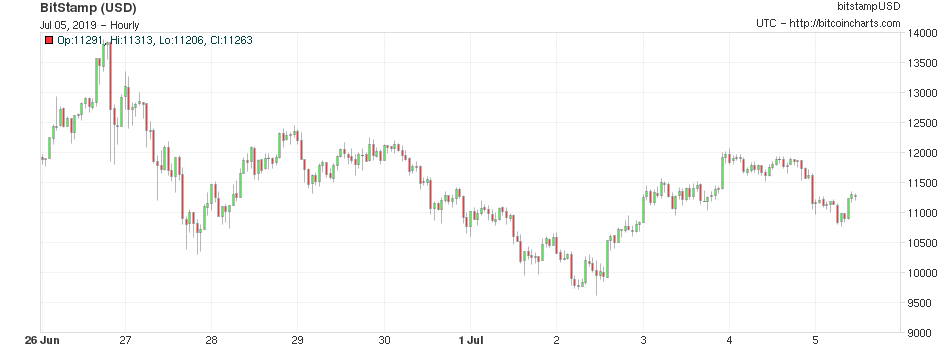
(Bitcoin: ten days)
It's been just over two months now since US jobless claims last hit a fresh low on the four-week moving average measure, dropping to 201,500. We keep an eye on this because research a while ago, by David Rosenberg at Gluskin Sheff, suggested that US stocks typically don't peak until after this four-week moving average has hit a low for the cycle, and a recession tends to follow about a year later (always remember that this is a tiny sample size and may not be reliable).
This week, the moving average rose to 222,250, while weekly claims came in quite a bit lower than expected at 221,000. We've also seen a new high in the stockmarket. So by this measure, we shouldn't yet expect a recession until next year although the chances of seeing a new trough in claims probably shouldn't yet be ruled out either especially as the latest US nonfarm payrolls data was actually pretty good compared to expectations.
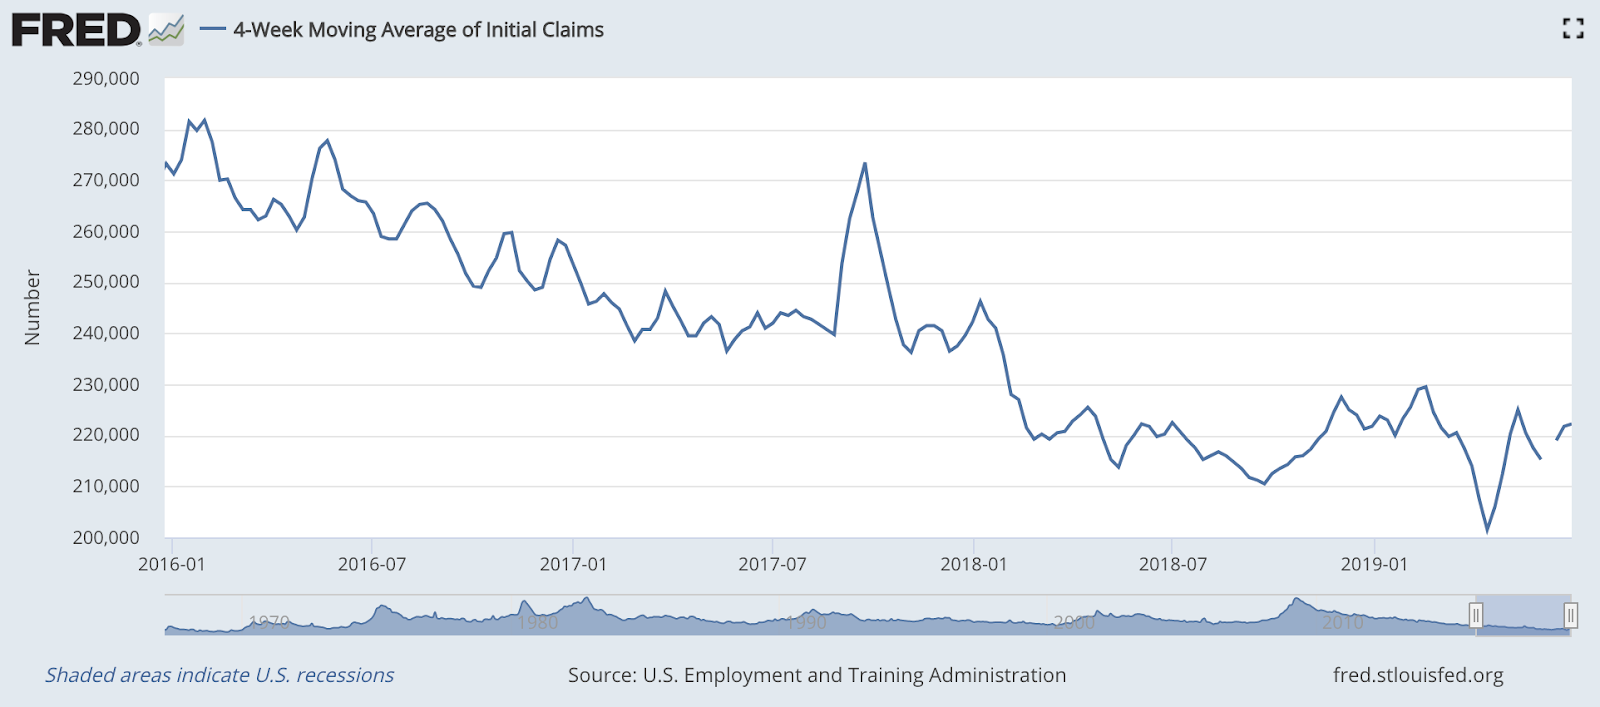
(US jobless claims, four-week moving average: since January 2016)
The oil price (as measured by Brent crude, the international/European benchmark) weakened this week, as inventories data showed that the US used less oil than expected.
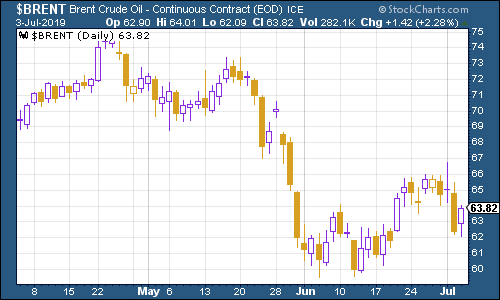
(Brent crude oil: three months)
Internet giant Amazon headed higher along with the rest of the market this week. Still a little way off its all-time high above $2,000 a share though.
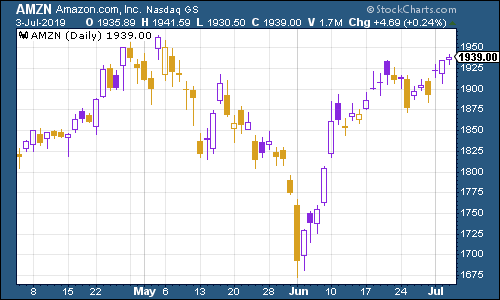
(Amazon: three months)
Meanwhile electric car group Tesla had a good week as it beat everyone's expectations it managed to deliver nearly 100,000 cars to customers in the second quarter. Those were record numbers, apparently. Tesla still has a lot to prove most of us would assume that the ability to make, sell, and deliver cars was pretty fundamental to being a competent car manufacturer, and doing all this at a profit still seems to escape Tesla. But we'll see.
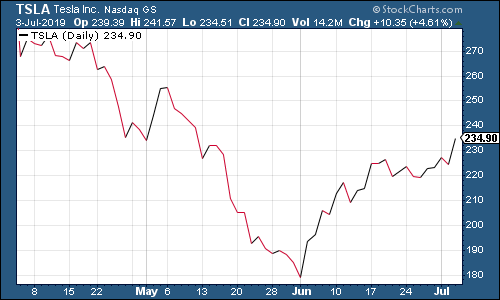
(Tesla: three months)
That's all for this week. Remember don't put off buying your tickets for the MoneyWeek Wealth Summit make sure you secure your seat now.
If you haven't yet read our report on The Future of Global Trade (in association with currency specialists OFX) then sign up to get it now it's a good in-depth read on the history of trade and how things might develop in the near future. It's totally free of charge just fill in your details here.
Get the latest financial news, insights and expert analysis from our award-winning MoneyWeek team, to help you understand what really matters when it comes to your finances.

-
 Average UK house price reaches £300,000 for first time, Halifax says
While the average house price has topped £300k, regional disparities still remain, Halifax finds.
-
 Barings Emerging Europe trust bounces back from Russia woes
Barings Emerging Europe trust has added the Middle East and Africa to its mandate, delivering a strong recovery, says Max King