The charts that matter: the market is on the turn
The volatility in global markets has continued this week. John Stepek looks to the charts that matter to get an idea of just what’s going on.

Get the latest financial news, insights and expert analysis from our award-winning MoneyWeek team, to help you understand what really matters when it comes to your finances.
You are now subscribed
Your newsletter sign-up was successful
Want to add more newsletters?

Twice daily
MoneyWeek
Get the latest financial news, insights and expert analysis from our award-winning MoneyWeek team, to help you understand what really matters when it comes to your finances.

Four times a week
Look After My Bills
Sign up to our free money-saving newsletter, filled with the latest news and expert advice to help you find the best tips and deals for managing your bills. Start saving today!
Welcome back. No new podcast this week (sorry!) but if you missed last week's, there's still time to hear Merryn and me getting riled up about Larry Summers and talking about market tops and the art world.
And if you missed any of this week's Money Mornings, here are the links you need.
Monday: How to avoid being ruined by nasty stockmarket surprises
MoneyWeek
Subscribe to MoneyWeek today and get your first six magazine issues absolutely FREE

Sign up to Money Morning
Don't miss the latest investment and personal finances news, market analysis, plus money-saving tips with our free twice-daily newsletter
Don't miss the latest investment and personal finances news, market analysis, plus money-saving tips with our free twice-daily newsletter
Tuesday: We've gone from "buy the dip" to "sell the rip"
Wednesday: What's next for US stockmarkets?
Thursday: It's hard to believe, but Britain's economy doesn't look too bad right now
Friday: From Acropolis Now to Arrivederci Roma get ready for the next big euro panic
Lastly, don't miss this week's issue of MoneyWeek magazine if you're not already a subscriber, sign up here now.
And now over to the charts. For context, the volatility in global markets has continued this week and it increasingly looks as though this sell-off might be more stubborn than the ones we've grown used to in recent years.
So be careful out there and definitely look at shifting your portfolio towards more defensive assets (we've looked at how to do that in the latest issue of MoneyWeek as I said earlier this week, now looks a good time to subscribe).
Gold (measured in dollar terms) is one classic example. The precious metal's rally has continued this week as the appetite for "safe havens" has grown.
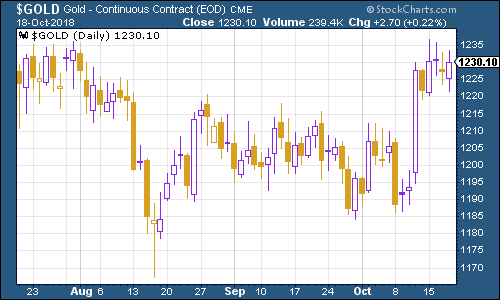
(Gold: three months)
The US dollar index a measure of the strength of the dollar against a basket of the currencies of its major trading partners rose again this week, with the dollar becoming more appealing as bond yields rose and also due to fear of wobbles elsewhere in the market.
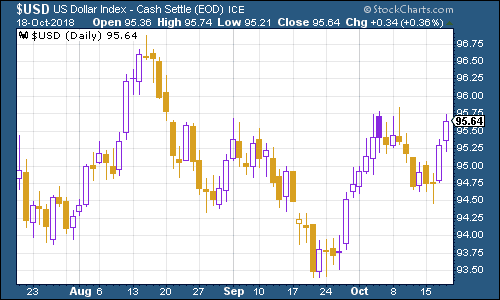
(DXY: three months)
The yield on the ten-year US Treasury bond remained below its highs but rose a little from last week. It's interesting (and suggestive of a genuine turn) to see jitters in the stock market but simultaneously see little appetite for bonds.
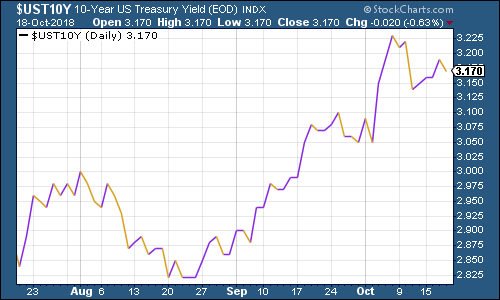
(Ten-year US Treasury yield: three months)
The Japanese government bond (JGB) yield climbed alongside its US counterpart.
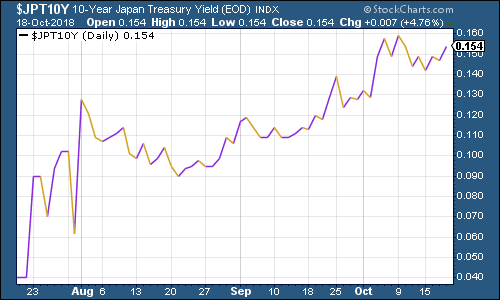
(Ten-year Japanese government bond yield: three months)
However, it was a very different story in Europe. The yield on the ten-year German bund (the borrowing cost of Germany's government, Europe's "risk-free" rate) fell hard this week as concerns about Italy continue to grow.
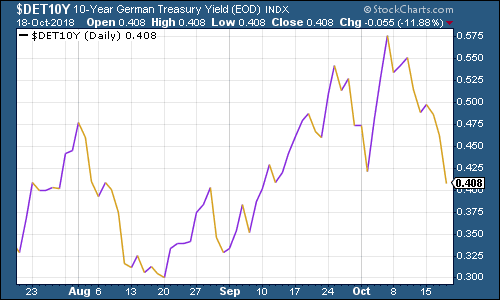
(Ten-year bund yield: three months)
Similarly, the gap between German and Italian bond yields which is the thing we need to watch just now widened to a five-year high this week. This simply shows how much more worried investors are about lending to Italy rather than Germany. We'll try to keep an eye on this chart on a regular basis from now on.
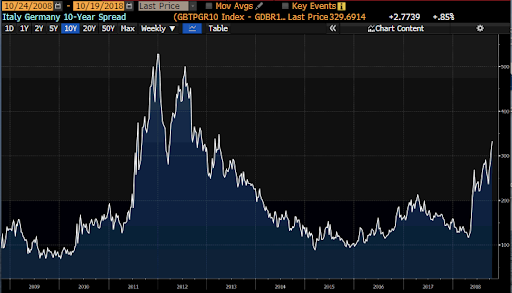
(I realise the y-axis is not clear it's above three percentage points now but all that really matters is that you can see it has really leaped higher in the last year).
Copper slipped somewhat this week, which is what you'd expect to see in a nervous, suddenly risk-averse market like this one. (It's a similar story for oil).
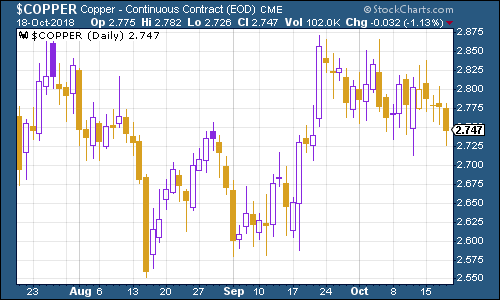
(Copper: three months)
Given its historic volatility, it's interesting to see that cryptocurrency bitcoin appears to have been sedated at a time when almost every other market is gripped by nerves. I do wonder if people have basically just stopped trading it, and got absorbed by cannabis stocks instead, perhaps.
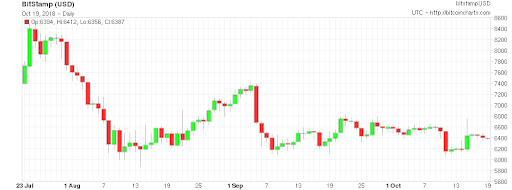
(Bitcoin: three months)
On US employment, the four-week moving average of weekly US jobless claims stayed close to its cycle low this week, although it is rising it came in at 211,750. Meanwhile weekly claims dipped a bit to 210,000.
As David Rosenberg of Gluskin Sheff has noted in the past, the stockmarket usually does not hit its peak until after we've seen jobless claims (as measured by the 14-week moving average) hit rock bottom for a cycle.
Based on an admittedly very small number of observations, the stockmarket peak usually follows about 14 weeks from when jobless claims hit the bottom, and a recession follows about a year later.
In other words, we should be a few months at least away from a peak, and at least a year away from recession as yet. But remember that is based on a small number of occurrences. Just watch out for any sustained rise in the number of jobless claims.
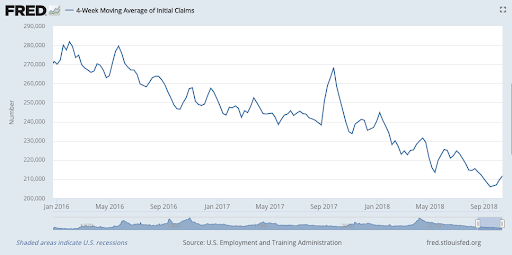
(US jobless claims, four-week moving average: since January 2016)
The oil price (as measured by Brent crude, the international/European benchmark) continued to fall along with wider markets.
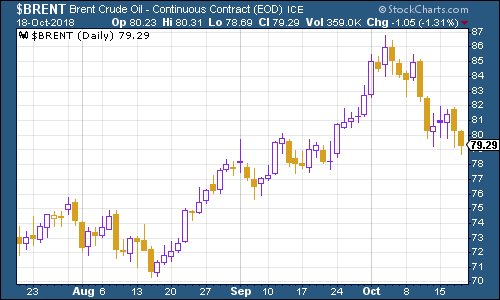
(Brent crude oil: three months)
Internet giant Amazon bounced somewhat from its relatively sharp drop last week. If you're going to buy anything on the dip, after all, it should be a stock that you won't be fired for owning when the downturn comes.
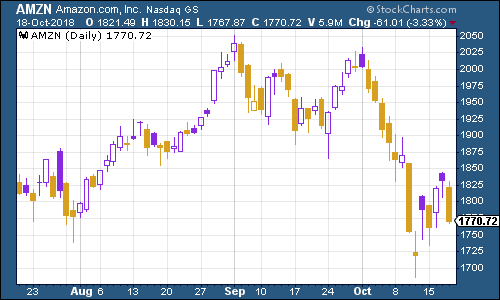
(Amazon: three months)
Electric car group Tesla had a pretty quiet week Elon Musk didn't do anything especially outrageous, although he did announce a price drop for the Tesla Model 3. Having a more affordable option is key to making the car-maker truly mass market. We'll see if he can pull it off.
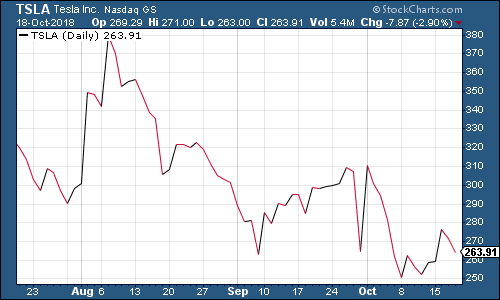
(Tesla: three months)
Get the latest financial news, insights and expert analysis from our award-winning MoneyWeek team, to help you understand what really matters when it comes to your finances.

-
 UK interest rates live: experts expect MPC to hold rates
The Bank of England’s Monetary Policy Committee (MPC) meets today to decide UK interest rates. The last meeting resulted in a cut, but experts think there is little chance of interest rates falling today.
-
 MoneyWeek Talks: The funds to choose in 2026
Podcast Fidelity's Tom Stevenson reveals his top three funds for 2026 for your ISA or self-invested personal pension