The charts that matter: it’s cryptogeddon out there
Bitcoin is crashing, bond yields are rising, and equities are a sideshow. John Stepek takes a look at the charts that matter to global markets.

Get the latest financial news, insights and expert analysis from our award-winning MoneyWeek team, to help you understand what really matters when it comes to your finances.
You are now subscribed
Your newsletter sign-up was successful
Want to add more newsletters?

Twice daily
MoneyWeek
Get the latest financial news, insights and expert analysis from our award-winning MoneyWeek team, to help you understand what really matters when it comes to your finances.

Four times a week
Look After My Bills
Sign up to our free money-saving newsletter, filled with the latest news and expert advice to help you find the best tips and deals for managing your bills. Start saving today!
Welcome to your weekend edition, where we take a look through the charts that matter and catch up on anything else that we missed during the week.
If you missed any of this week's Money Mornings, here are the links you need.
Monday:Now that the easy money has been made, where should you invest?
MoneyWeek
Subscribe to MoneyWeek today and get your first six magazine issues absolutely FREE

Sign up to Money Morning
Don't miss the latest investment and personal finances news, market analysis, plus money-saving tips with our free twice-daily newsletter
Don't miss the latest investment and personal finances news, market analysis, plus money-saving tips with our free twice-daily newsletter
Tuesday:When will the market freak out about rising bond yields?
Wednesday:The dollar is due a rebound but long-term, it looks like it's in a bear market
Thursday:Capita may be no Carillion, but it's still not one for your "buy" list
Friday:Wish the new Fed chair luck he'll really, really need it
And if you missed this week's podcast, you can listen to it here. Merryn and I talked about George Orwell, George Soros, and why their views both matter to anyone who owns big tech companies right now.
The next podcast will be out on Monday.
So what's the big news this week? It's all about bonds and bitcoin. Bitcoin is crashing, bond yields are rising, and equities are basically still a sideshow (they're typically the last to catch up).
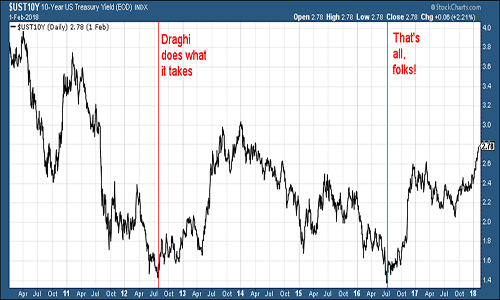
In a nutshell, here's what's going on. Take a quick look at the chart below. It's a chart of US ten-year Treasury yields over the last eight years or so.
In July 2012, Mario Draghi said he would do "whatever it takes" to save the euro. That was shorthand for saying: "I'm going to do exactly what every other developed government across the world has done I'm going to print enough money to underwrite the solvency of the European financial system. And I'll print as much as it takes."
This is the point at which the war on deflation was truly won. Deflation is a powerful, but finite force. At some point, everyone goes bust. Inflation is not: governments can print as much money as they like until it does something.
It's like trying to fill an incredibly deep pit with water. At first you can't see the water hitting the bottom. It seems futile. But as long as the pit isn't actually bottomless, then it will eventually fill up.
So Draghi's promise drew a final line under the crisis. But it took until last summer for people to finally realise that Europe really had been "saved". The Brexit vote resulted in a hurried scramble for "safe havens" too. But by that point, the sorts of statistics we were seeing in the bond market were patently ridiculous (50-year negative yield Swiss debt anyone? How about an Argentinian century bond?)
Now markets are waking up to the fact that the "secular stagnation" narrative the one that was rolled out by the same incredibly bright people who entirely failed to see the 2008 financial crisis coming is, to put it gently, a lot of tripe.
Growth is back. US payrolls data released on Friday this week, showed that jobs growth was healthy, but more importantly, that year-on-year wage growth hit 2.9%. Meanwhile, the Atlanta Fed now reckons that GDP is going to come in at a whopping 5%-plus this quarter. It won't be that high (the Atlanta Fed uses data as it comes out to add to a "flash" estimate of GDP it's called "now-casting"), but it's still likely to be impressive.
What does that mean? To be honest, it could be Wall Street's worst nightmare. A recovering real economy means rising interest rates and rising wages, which almost certainly has to squeeze corporate earnings. And it's possible that the market is just waking up to that now.
Anyway let's take a look at the charts.
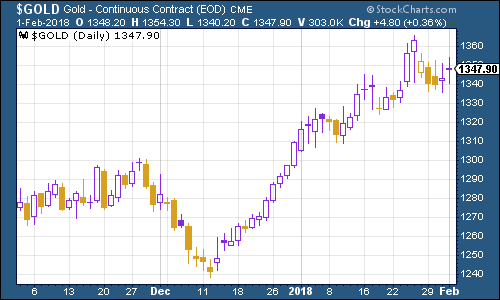
Gold edged lower despite the weakening US dollar. Rising bond yields are one element at work here rising interest rates are not necessarily good for gold. However, in the longer run, if interest rates rise more slowly than inflation (which I still suspect is what we'll see) then that should be good news for the yellow metal.
(Gold: three months)
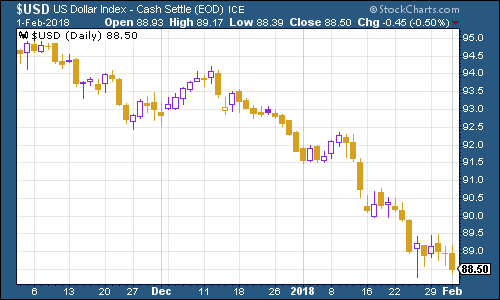
The US dollar index a measure of the strength of the dollar against a basket of the currencies of its major trading partners continued its descent. The drop has rather baffled the investment media collective, which is one reason why I suspect it'll probably continue. That said, the stronger-than-expected employment data released on Friday afternoon has just delivered the rebound that my colleague Dominic suspected was in the pipeline.
(DXY: three months)
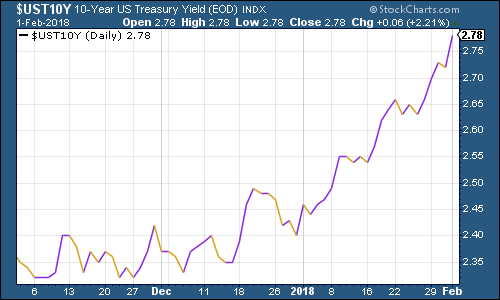
The yield on the ten-year US Treasury bond has headed sharply higher this week. It's now well above various lines in the sand and heading on its way to 3%, which would be a much more striking sign that the bond bull market isn't just over but the bond bear market has begun.
(Ten-year US Treasury: three months)
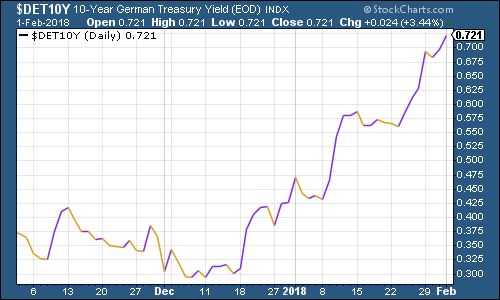
How about the ten-year German Bund? This the borrowing cost of Germany's government essentially represents Europe's "risk-free" rate. As you can see, there's still a large "spread" or gap between this and the US rate, but the German bond is following its US peer higher. (And on that note, the Japanese ten-year has also gone significantly higher, and is now daring the Japanese central bank to intervene to keep the yield below the 0.1% that seems to be an informal target for them).
(Ten-year bund yield: three months)
Copper had a fairly uneventful week. On balance, given strong growth figures, I'd still expect it to continue higher.
(Copper: three months)

Bitcoin ah bitcoin. It's starting to look as though all of those "top of the market" indicators we saw in December were indeed, indicative of a market top. That includes ahem this particular, wonderful example of the magazine cover indicator at work
Bitcoin has now dropped by more than 50% from the peak, and it's been one of the better-performing cryptocurrencies. Where will it stop? I have no idea but I won't be buying the dips.
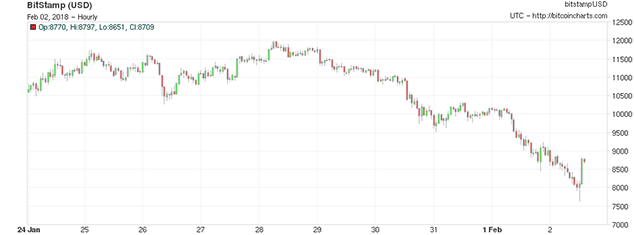
(Bitcoin: ten days)
As for US employment non-farm payrolls were strong, but the indicator we like to keep an eye on is the four-week moving average of weekly US jobless claims, which fell back to 234,500 this week, while weekly claims came in at 230,000.
According to David Rosenberg of Gluskin Sheff, when US jobless claims hit a "cyclical trough" (as measured by the four-week moving average), a stockmarket peak is not far behind (on average 14 weeks), a recession follows about a year later.
But as the chart below shows, the most recent cyclical trough was in November, at 231,250. So we could still be some way from the peak. And if they stay at current levels then we may hit a new low before too long.
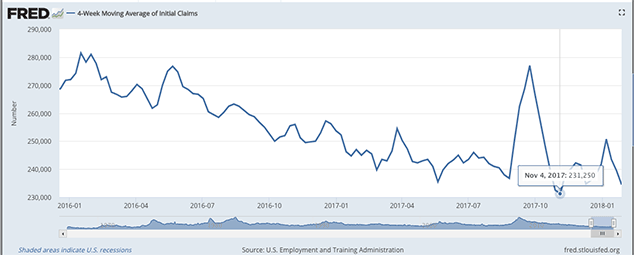
(Four-week moving average of US jobless claims: since start of 2016)
The oil price (as measured by Brent crude, the international/European benchmark) fell below $70 a barrel. What's interesting in oil at the moment is that West Texas Intermediate (typically seen as the US benchmark) is now challenging Brent's dominance. Huge production by US shale providers and the ability to export has now boosted WTI trading volumes dramatically.
Thing is, that near-record US production might also start to take its toll on prices. But we'll see as the FT points out, demand is currently a lot higher than it was back when oil was at $100 a barrel.
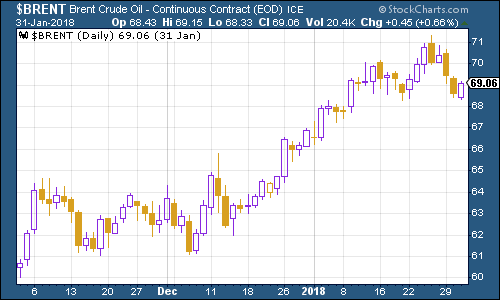
(Brent crude oil: three months)
Internet giant Amazon saw its share price trip up later in the week, but it's hardly doing badly. And results which came out after this chart closes (it shows the close on Thursday night) sent the share price rising again. It added more new Prime subscribers during 2017 than it has in any previous year, which is good news Prime members tend to buy more from Amazon and of course, they're paying for membership every year. Also, sales of Alexa the company's digital assistant are beating expectations.
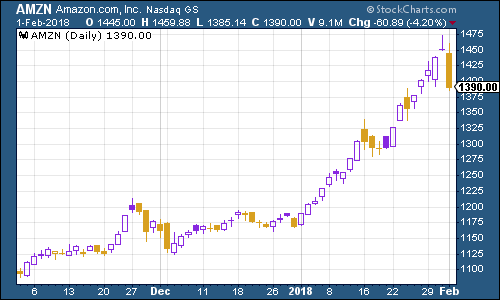
(Amazon: three months)
Tesla continued to defy gravity, as founder Elon Musk indulged in more attention-grabbing antics by selling limited edition flamethrowers to raise $10m for Musk's "Boring Company" which he founded to drill transport tunnels.
I love Musk's sci-fi ambitions. But I can't see the financial rationale for owning his company's shares. I may well be wrong. And I certainly wouldn't short a stock like Tesla (might as well use one of Elon's flamethrowers to torch your cash instead).
But I still think this will all end in tears or at least some burnt fingers.
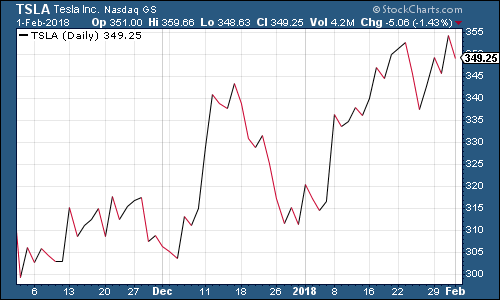
(Tesla: three months)
Get the latest financial news, insights and expert analysis from our award-winning MoneyWeek team, to help you understand what really matters when it comes to your finances.

-
 Can mining stocks deliver golden gains?
With gold and silver prices having outperformed the stock markets last year, mining stocks can be an effective, if volatile, means of gaining exposure
-
 8 ways the ‘sandwich generation’ can protect wealth
People squeezed between caring for ageing parents and adult children or younger grandchildren – known as the ‘sandwich generation’ – are at risk of neglecting their own financial planning. Here’s how to protect yourself and your loved ones’ wealth.