A bad week for gold – but a belter for bitcoin
There have been some interesting moves in our six “charts that matter” this week, says John Stepek.

Get the latest financial news, insights and expert analysis from our award-winning MoneyWeek team, to help you understand what really matters when it comes to your finances.
You are now subscribed
Your newsletter sign-up was successful
Want to add more newsletters?

Twice daily
MoneyWeek
Get the latest financial news, insights and expert analysis from our award-winning MoneyWeek team, to help you understand what really matters when it comes to your finances.

Four times a week
Look After My Bills
Sign up to our free money-saving newsletter, filled with the latest news and expert advice to help you find the best tips and deals for managing your bills. Start saving today!

There have been some interesting moves in our six "charts that matter" this week.
Gold
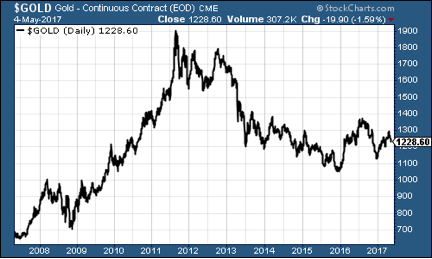
Practically everything has been stacked against gold this week. Firstly, the US Federal Reserve was a tad more bullish in its assessment of the US economy than anyone had expected at its meeting on Wednesday, which caused markets to revise up their expectations for the pace of rate rises, which is never great for gold.
Secondly, markets are fairly relaxed about the French election this weekend. It might still go Marine Le Pen's way, but that does seem unlikely. Again, a calming of geopolitical nerves has made investors less inclined to own gold.
MoneyWeek
Subscribe to MoneyWeek today and get your first six magazine issues absolutely FREE

Sign up to Money Morning
Don't miss the latest investment and personal finances news, market analysis, plus money-saving tips with our free twice-daily newsletter
Don't miss the latest investment and personal finances news, market analysis, plus money-saving tips with our free twice-daily newsletter
Finally, the commodities sector in general has been having a tough time, as we'll get to in just a moment. This isn't always bad news for gold but on this occasion, gold has followed the rest of its industrial compatriots lower.
Copper
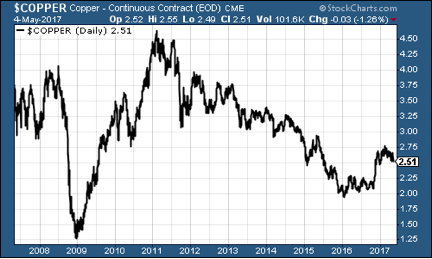
The big concern for commodities (and gold to a lesser extent) is China. As I wrote in Money Morning earlier this week, investors are starting to fret about a crackdown on borrowing in China and a resulting slowdown in growth.
When China reins in monetary creation, it's always bad news for the commodities sector. Whether or not this spreads to other parts of the asset markets is another question. With oil falling hard as well, markets might be inclined to look on the bright side and see it as good for consumers and for corporate profits (as costs are lower).
US dollar
US dollar
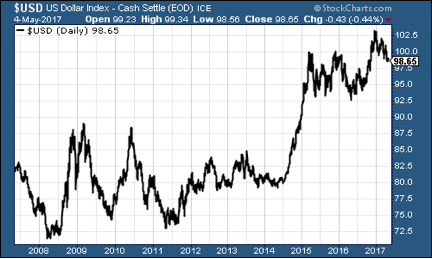
This is another chart that points to the real concern being China right now. Normally when I see gold slide, I usually look to the dollar to rise strongly and clearly that's not been the case this week.
Depending on the French election result, the dollar index could fall further the euro makes up a large chunk of the index, so if it strengthens after an Emmanuel Macron victory, then the dollar could weaken.
US Treasuries
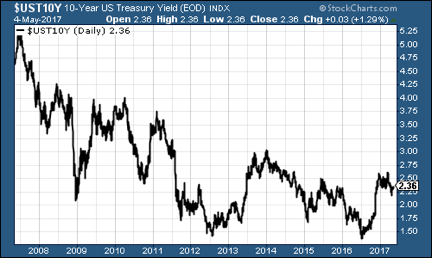
In a similar vein, there's ten-year US Treasury bonds. Yields are continuing to pick up a little, rising from 2.3% last time, to 2.36% now. This is partly down to expectations for a Fed rate rise being brought forward by investors,
Bitcoin
I told you last week that Charlie Morris, my colleague and editor of The Fleet Street Letter, had put a $1,700 target on bitcoin. Well, we're already nearly there, as you can see:
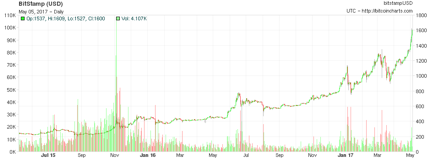
Source:bitcoincharts.com
This is quite unusual. Bitcoin often moves similarly to gold. It also reacts badly when China seems to be in trouble (although of course, some of this week's gains could be driven by people trying to get their money out of China). So why hasn't bitcoin fallen out of bed this week with everything else?
It's partly because of huge demand from Japan. The Japanese recently deemed bitcoin a legal means of payment and investors and speculators are lapping it up.
And when you look at that chart above, you have to think that bitcoin is moving into its parabolic phase now (or another one at least). Is it a bubble? That word is overused, and in any case, I don't think it is. But as bitcoin hogs more and more headlines, and draws more and more new money, we could see a mania developing that takes the price well beyond where it is today.
Again, it's all speculative. But it's interesting stuff.
US jobless claims
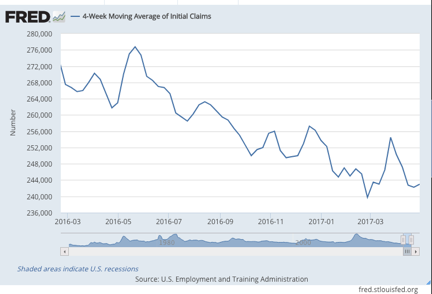
As the short-term chart aboveshows, it looked as though jobless claims troughed at just under 240,000 at the end of February. So we'd be looking at the market (the S&P 500) peaking around the end of May.
However, this week jobless claims fell sharply to 238,000. Another few runs like this, and we might find that the indicator hits a new trough and maybe we're safe from recession for another few months.
Get the latest financial news, insights and expert analysis from our award-winning MoneyWeek team, to help you understand what really matters when it comes to your finances.

-
 ISA fund and trust picks for every type of investor – which could work for you?
Whether you’re an ISA investor seeking reliable returns, looking to add a bit more risk to your portfolio or are new to investing, MoneyWeek asked the experts for funds and investment trusts you could consider in 2026
-
 The most popular fund sectors of 2025 as investor outflows continue
It was another difficult year for fund inflows but there are signs that investors are returning to the financial markets
-
 'Investors should brace for Trump’s great inflation'
Opinion Donald Trump's actions against Federal Reserve chair Jerome Powell will likely stoke rising prices. Investors should prepare for the worst, says Matthew Lynn
-
 'Governments are launching an assault on the independence of central banks'
Opinion Say goodbye to the era of central bank orthodoxy and hello to the new era of central bank dependency, says Jeremy McKeown
-
 Do we need central banks, or is it time to privatise money?
Analysis Free banking is one alternative to central banks, but would switching to a radical new system be worth the risk?
-
 Will turmoil in the Middle East trigger inflation?
The risk of an escalating Middle East crisis continues to rise. Markets appear to be dismissing the prospect. Here's how investors can protect themselves.
-
 Federal Reserve cuts US interest rates for the first time in more than four years
Policymakers at the US central bank also suggested rates would be cut further before the year is out
-
 The Bank of England can’t afford to hike interest rates again
With inflation falling, the cost of borrowing rising and the economy heading into an election year, the Bank of England can’t afford to increase interest rates again.
-
 Interest rates held at 5.25% again
The Bank of England has kept rates at 5.25% again, in a widely anticipated move. We look at what it means for your money - and what the Bank’s next move could be
-
 US inflation rises to 3.7% as energy prices surge - will the Fed hike rates?
US consumer price index rose in August but markets do not expect a rate hike this month