Five signs that the market has peaked
Knowing when a stock market has topped out is notoriously difficult. But there are clues that can help you, says Simon Caufield. Here, he outlines five.
Get the latest financial news, insights and expert analysis from our award-winning MoneyWeek team, to help you understand what really matters when it comes to your finances.
You are now subscribed
Your newsletter sign-up was successful
Want to add more newsletters?

Twice daily
MoneyWeek
Get the latest financial news, insights and expert analysis from our award-winning MoneyWeek team, to help you understand what really matters when it comes to your finances.

Four times a week
Look After My Bills
Sign up to our free money-saving newsletter, filled with the latest news and expert advice to help you find the best tips and deals for managing your bills. Start saving today!
How do you know when a stock market has bottomed out? It's one of the most difficult questions that you will reckon with as an investor.
And in all my years of research, I think the person who has answered it best is financial historian Russell Napier.
In his seminal book Anatomy of a Bear, Napier set out to find the clues that tell you when a bear market is over. He researched the four great 20th century market bottoms - August 1921, July 1932, June 1949 and August 1982. These were the best four times to buy stocks in the last 100 years. If you'd bought then, you could have made between four and seven times your money in less than ten years.
MoneyWeek
Subscribe to MoneyWeek today and get your first six magazine issues absolutely FREE

Sign up to Money Morning
Don't miss the latest investment and personal finances news, market analysis, plus money-saving tips with our free twice-daily newsletter
Don't miss the latest investment and personal finances news, market analysis, plus money-saving tips with our free twice-daily newsletter
Remember that Napier was writing about market bottoms. But I'll be applying his lessons to today's market. There are five things you need to watch for when looking for a market top
1.Rising government bond yields
In four major bear market bottoms (1921, 1932, 1949 and 1982), stocks started rising a few months after government bonds rallied (Figure 1). In 1921, it was 14 months after; 1932 seven months; 1949 nine months and 1982 11 months. This is remarkable. You'd expect bonds to rally after 1982 because inflation was abating. But not in 1921 and 1932 when deflation was about to ease. And in 1949, the Federal Reserve was purchasing bonds to hold yields down. It's not easy to see on the chart because yields were also very low back then.
Figure 1: Real S&P 500 index and ten-year Treasury bond yields since 1871
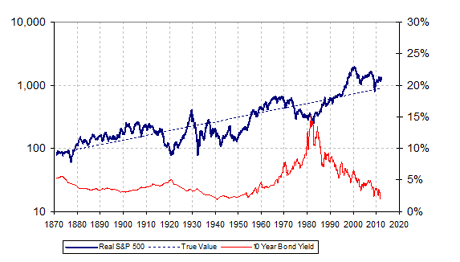
I think this is one reason the stock market bulls are wrong today. They don't realise just how much stocks are inflated by record low interest rates. Maybe it's understandable. Bond yields have been falling for 30 years. Few investors have experienced a rising yield environment. Many say bonds and stocks can't fall at the same time. There would be no markets big enough to absorb all that money. Well, stocks and bonds both fell between 1968 and 1982 and from 1906 to 1921. And I think it's about to happen again.
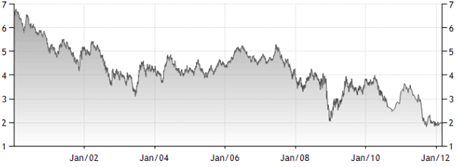
Have bond yields already bottomed? Of course, we don't know. But take a look at Figure 2. US ten-year government bond yields are up nearly 50 basis points from their lows last autumn. So we might already be six months past the bottom. And we might not have long to wait for another leg down in stock markets.
Figure 2: US ten-year government bond yield since 2000
Source: www.tradingeconomics.com , US Department of the Treasury
2. Rising corporate bond yields
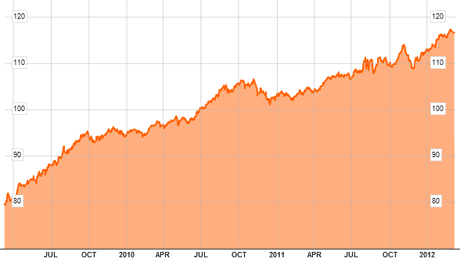
Corporate bond yields are an even timelier warning sign. In 1921, corporate bond prices started rising just two months before stocks. In 1932, it was one month. And in 1982, it was five months. In 1949, it took 15 months but according to Russell Napier, that was the Fed distorting the bond markets after the World War II.
Figure 3: ishares Investment Grade Corporate Bond ETF three-year performance
Source: Bloomberg
Looking at Figure 3, there's little sign of corporate bond prices turning down yet. But remember, they might only give us one month's notice. Stay tuned.
3. Peaking profits
Napier's research suggests that company profits are another useful signal of market turning points. But they often keep falling after stock markets bottom out. So normally they're a lagging indicator.
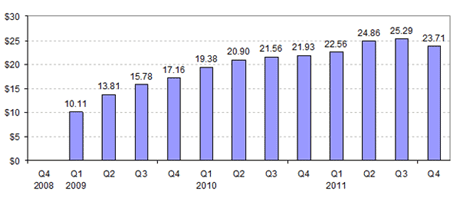
If so, we must be very close to a market top. Why? Well, US company profits in the fourth quarter of 2011 were 8% above the same quarter in 2010 (Figure 4). But they were 6% lower than the previous quarter. That's the first quarterly decline since the fourth quarter of 2008. And it would only take a 5% fall for Q1 2012 profits to drop below the same quarter one year ago. If it happens, Napier's research suggests the markets could top-out before first quarter results.
Figure 4: S&P 500 quarterly earnings per share since Q4 2008
Source: Standard & Poor's
I think it will happen. First, Q4 results are boosted by Christmas at the expense of Q1. Second, Apple alone contributed 4% to the final quarter of 2011. And its blowout results will probably not be repeated. Third and most important, the problems that companies blamed for weak fourth quarter results are getting worse. Weaker government spending, a stronger dollar, recession in Europe and a slower China are all likely to add further pressure to earnings.
4. Dow Theory
Dow Theory holds that transport stocks turn before the wider market. It makes sense. If the economy is slowing, the first companies to notice it should be those that transport goods via truck, train or plane.
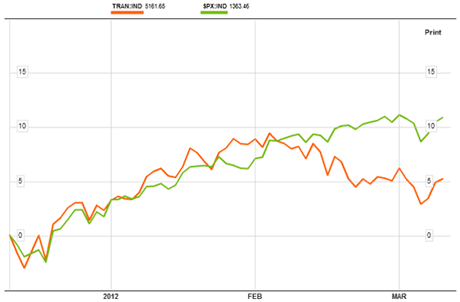
Well, Napier says that it works. So take a look at Figure 5. The Dow Jones Transportation Index (in orange) started underperforming the S&P 500 (in green) at the beginning of February.
Figure 5: Dow Transport index versus S&P 500 last three months
Source: Bloomberg
What's more, the American Association of Railroads' monthly report says that February freight-car loadings are down 2% compared to last year and 3% compared to last month. This could be one of the first signs of impending US recession.
5. Beware falling industrial metals prices
Napier also reports that industrial metals prices anticipate stock market turning points especially copper.
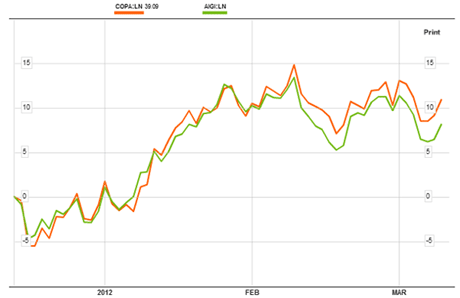
Figure 6 shows the performance of two ETFs. The orange line tracks the price of copper; the green one a basket of industrial metals. Both are now lower than their highs of early last month.
Remember, stocks have risen over the last month. And the bulls will tell you that's partly because the economy is improving. But if the economy is improving, why have the prices of industrial metals stagnated and started to fall? It does not make sense.
Figure 6: Copper and industrial metals price performance last three months
Source: Bloomberg
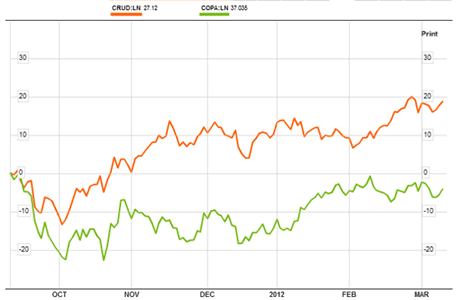
Of course, one month's data is far from conclusive. But some analysts say you can't just look at industrial metals alone. Commodities are affected by central bank money printing as well as the economy. To isolate the effect of money printing, you should compare copper with oil. Copper is more sensitive to economic growth than oil. So the economy is getting better only if copper outperforms oil.
As you see in Figure 7, copper prices have been underperforming oil for six months. So the economy is probably slowing.
Figure 7: Oil and copper prices last six months
Source: Bloomberg
What do the signals tell us?
Don't misunderstand me. It's risky to rely on conclusions drawn from only a few examples. But they are the only examples we've got. And I feel that a lot of circumstantial evidence is pointing the same way. Three of these five signals are flashing red. Company profits, industrial metal prices and transport stocks seem to have turned down already. One is flashing amber. Government bond yields stopped falling six months ago, and they are up slightly. But the evidence is not yet conclusive. Only the corporate bond signal remains green. And it's the one that usually gives the least notice.
The two market sentiment signals are also flashing red. Trading volumes are light. And the market is shrugging-off bad news. That makes five red, one amber and one green signal. Five and a half out of seven seems about right to me. I'm about 80% sure stocks are headed lower in the near future.
Simon Caufield is the editor of True Value, where a version of this essay was first published on 16 March.
Get the latest financial news, insights and expert analysis from our award-winning MoneyWeek team, to help you understand what really matters when it comes to your finances.
Simon Caufield started out as an engineer and has an MA in engineering from Cambridge. This was followed by an MBA from the London Business School.
After graduating, Simon worked his way up to become a Management Consultant for banks and insurance companies. This gave him the chance to see the city from the inside.
In 2001, Simon started his own company to develop software designed to price banking services, such as loans and deposits. After growing the company to 100 employees, he went on to sell this in 2007, looking for his next challenge.
Also during 2007, Simon ‘sacked’ his fund managers and took complete control over his investments. Now he devotes all his time to investing and is an angel investor to help start-up companies. He has built up a reputable 20 years in the industry.
Simon writes his own investment newsletter – True Value. This follows the strategy he established in 2007 and is based on assets that are priced way below their true value. He scours the worldwide markets for equities, bonds and alternative investments to find opportunities that fit his conservative and contrarian approach.
-
 The most single-friendly areas to buy a property
There can be a single premium when it comes to getting on the property ladder but Zoopla has identified parts of the UK that remain affordable if you aren’t coupled-up
-
 RICS: UK housing market showing signs of 'tentative recovery'
RICS members are becoming less negative about property sales and house prices. What does the latest data mean for the property market?