How to cope with volatility in the markets
While sometimes unpleasant, volatility is to be expected when investing in shares. Phil Oakley outlines some ways you can minimise the stress.
Get the latest financial news, insights and expert analysis from our award-winning MoneyWeek team, to help you understand what really matters when it comes to your finances.
You are now subscribed
Your newsletter sign-up was successful
Want to add more newsletters?

Twice daily
MoneyWeek
Get the latest financial news, insights and expert analysis from our award-winning MoneyWeek team, to help you understand what really matters when it comes to your finances.

Four times a week
Look After My Bills
Sign up to our free money-saving newsletter, filled with the latest news and expert advice to help you find the best tips and deals for managing your bills. Start saving today!
Buying shares in a company is risky. The main risk is that, as a shareholder, you are last in the queue to get paid your share of the profits, or of the assets if the firm goes bust. Shareholders accept this risk because they also stand to make bigger gains than anyone else if the firm does well.
But there's another form of risk that's arguably less well understood: volatility. In plain English, volatility measures how much of a roller-coaster ride an investment gives you. And shares even big blue chips canbe very volatile. The returns from the shares bounce around a great deal, with both big surges and painful crashes highly likely.
Professional investors calculate the volatility of an investment by working out the standard deviation (SD) of its historic returns. This measures how much the returns bounce around their long-term average (mean') values. The bigger the SD, the riskier the investment.
MoneyWeek
Subscribe to MoneyWeek today and get your first six magazine issues absolutely FREE

Sign up to Money Morning
Don't miss the latest investment and personal finances news, market analysis, plus money-saving tips with our free twice-daily newsletter
Don't miss the latest investment and personal finances news, market analysis, plus money-saving tips with our free twice-daily newsletter
For example, between 1987 and 2013, UK shares produced average annual returns of 9.3%, with an SD of 16.2%. UK government bonds produced average annual returns of 8.3% with an SD of 9.7% they were much safer.
Why is volatility risky? Because owning the wrong investment at the wrong time can have a serious impact on your net worth. If your portfolio is stuffed full of shares right before you need to remove the money from it (for retirement, say), then the risk is that the market will crash at exactly the wrong moment and you won't have enough time to wait for a recovery.
The other big risk of volatility is that it makes people do stupid things with their money. When they see shares race up, they buy in the hope of making lots of money. When prices fall, they panic and sell right at the bottom, rather than hanging on. In short, volatility encourages undisciplined investors to buy high and sell low the opposite of what they should do.
But while volatility is scary in the short term, over the long run it tends to smooth itself out good years offset the bad.
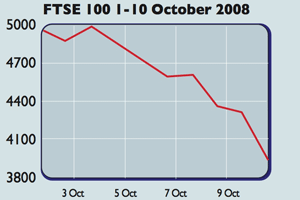
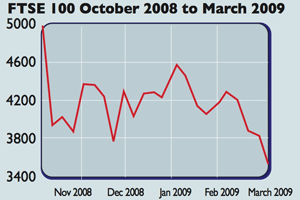
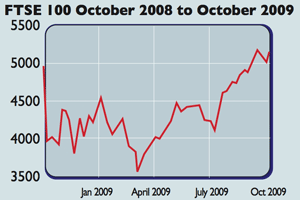
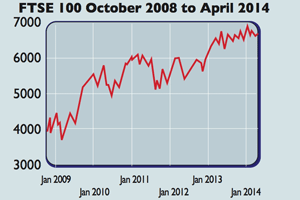
The charts below show what I mean. This means that once you have a better understanding of volatility, you can use that understanding to help you ride it out, while less disciplined investors panic.
Strategies to cope with volatility
To smooth out the ups and downs, consider making regular investments say monthly rather than lump-sum payments. This is known as pound-cost averaging'. It means you automatically buy more shares when prices are falling (because a fixed regular saving of £100 will buy you more shares when the price falls) and less when they are high.
Focusing on shares that pay dividends is also a good idea. You can use the dividend income to buy more shares and compound your returns. The great thing about dividends is that once they've been paid, they cannot be taken away unlike a rise in a share price. They are also a key part of the total return you get from shares even more so if you reinvest them.
Perhaps more importantly, dividends are a lot less volatile than share prices. In 2008/2009 the UK stock market fell by a third, but dividends only fell by 11%.
Since 1970, UK share prices have gone up by an average of 7.9% a year, with huge volatility of 27.8%. By contrast, dividends have risen by 7.2% a year with volatility of just 7.6%. So dividends matter a lot.
Riding out the storm
Chart 1: I feel bad
If you'd bought in to the FTSE 100 on 1 October 2008, ten days later you'd have lost over 20%.
Chart 2: I feel even worse
Five months later, your losses hit 29%.


Chart 3: I feel a bit better
But a year on, you'd have been sitting on a small gain (on top of pocketing some dividends too).
Chart 4: I am fairly happy
Fast forward to April 2014, and your investment is up by more than a third a gain of 6.8% a year, excluding dividends.


Get the latest financial news, insights and expert analysis from our award-winning MoneyWeek team, to help you understand what really matters when it comes to your finances.
Phil spent 13 years as an investment analyst for both stockbroking and fund management companies.
-
 ISA fund and trust picks for every type of investor – which could work for you?
Whether you’re an ISA investor seeking reliable returns, looking to add a bit more risk to your portfolio or are new to investing, MoneyWeek asked the experts for funds and investment trusts you could consider in 2026
-
 The most popular fund sectors of 2025 as investor outflows continue
It was another difficult year for fund inflows but there are signs that investors are returning to the financial markets