Get the latest financial news, insights and expert analysis from our award-winning MoneyWeek team, to help you understand what really matters when it comes to your finances.
You are now subscribed
Your newsletter sign-up was successful
Want to add more newsletters?

Twice daily
MoneyWeek
Get the latest financial news, insights and expert analysis from our award-winning MoneyWeek team, to help you understand what really matters when it comes to your finances.

Four times a week
Look After My Bills
Sign up to our free money-saving newsletter, filled with the latest news and expert advice to help you find the best tips and deals for managing your bills. Start saving today!
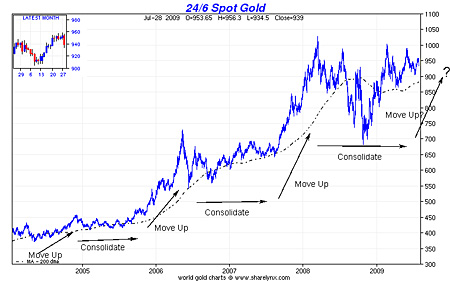
Since this bull market in gold began some ten years ago, the metal has repeatedly traced out a pattern. Loosely speaking, it makes a move up, which lasts some six to nine months, then consolidates at this higher level for a year to 18 months, then makes its next move up.
Gold made one such big move between summer 2007 and spring 2008, when it moved from about $660 to above $1,000. Since then we have been consolidating in the $700 to $1,000 range.
If gold continues to play out this pattern, it should be looking to start its next major move some time over the next six or seven weeks.
MoneyWeek
Subscribe to MoneyWeek today and get your first six magazine issues absolutely FREE

Sign up to Money Morning
Don't miss the latest investment and personal finances news, market analysis, plus money-saving tips with our free twice-daily newsletter
Don't miss the latest investment and personal finances news, market analysis, plus money-saving tips with our free twice-daily newsletter
I have drawn some arrows on this first chart, which shows gold over the last five years, to demonstrate this stepping pattern I've been describing.

You'll notice that gold's big moves often begin quietly in the summer months, which is why I have been looking for a trade-able summer low in gold, ideally some time in the July to August timeframe.
The problem is that gold has remained stubbornly above the $900 mark. It has not presented us with an obvious low. Not yet, anyway.
How to tell when gold is at a low
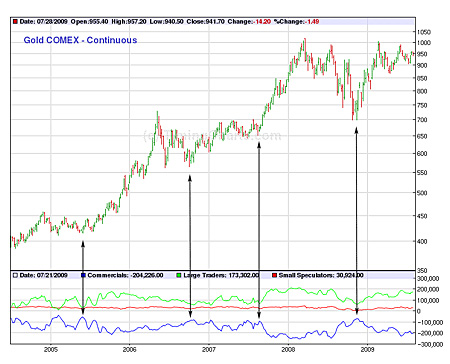
On the gold futures exchange, the Comex, you will find three sets of traders. There's the commercials, who are professional traders often hedging gold for large mining companies who want to lock in a particular price for metal they are about to mine. Then there are the large traders often funds and finally, the small speculators. One of most useful short-term indicators of the direction of the gold price is to look at the position these traders have taken, particularly the commercial traders. For some reason, this is a better indicator of lows than it is of highs.
Enjoying this article? Sign up for our free daily email, Money Morning, to receive intelligent investment advice every weekday. Sign up to Money Morning.
If the large traders do not have a sizeable long position and the commercial traders have a small (less than 150,000 contracts) short position, this tends to suggest that we are at some kind of low. As this next chart shows, this was the case at all the major lows ie good entry points of the last few years. The blue line shows the short position of the commercials and the green line shows the long positions of the large traders.

What's worth noting about the current positions of the traders is that both the large traders and the commercials have fairly sizeable positions at around 200,000 contracts. That is not indicative of a low. If anything it suggests that a correction in gold is imminent in fact it looks like it may have began yesterday.
From an academic point of view what I would like to see and bear in mind that markets never do what you want them to, particularly when you express your ideals in public is for gold to correct to around $860 and for the commercial traders' short position to sink to around 120,000 contracts. I would suggest we need some kind of panic to spark this off, as, for now, there are more people happy to sell gold above $950 an ounce than there are people to buy it.
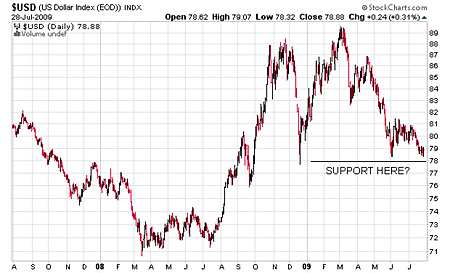
How does gold measure up against the dollar and the pound?
If the US dollar is finding support here at between 78 and 79 on the dollar index, as appears to be the case, we should get a correction in gold, in dollar terms at least.

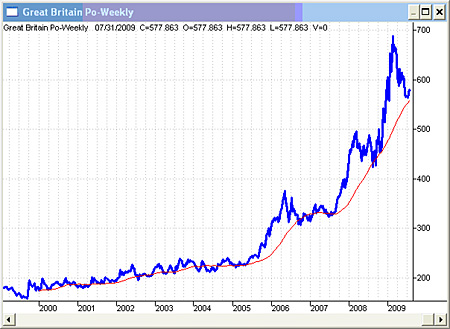
UK-based purchasers might like to take a look at this next chart, which shows gold priced in sterling since 1999, when our glorious leader sold ours.

The chart quite clearly shows gold's stepping pattern and suggests, in sterling terms, that we have a way more consolidation to go. But remember that gold, (which is in effect another currency), measured in sterling and gold measured in US dollars do not always move together. It depends on the relative strength of the currencies.
When should you buy in to gold?
The red line on the chart above shows the 52-week moving average - the average price of gold for the past year. As you can see, when the gold price pulls back to this line it has consistently marked a decent entry point for those buying in. So for those who do not currently own any gold, I would suggest that somewhere between £520 and £550 an ounce, just below the red line, is a good price to buy in. I suspect we will see that price some time in the coming weeks. And I hope it will coincide with the beginning of another big move in gold.
Our recommended article for today
Covered calls: a strategy for the adventurous investor
Selling 'options' may sound like something reserved solely for the professional investor. But one strategy for the bolder private investor is the 'covered call'. Here's how it works.
Get the latest financial news, insights and expert analysis from our award-winning MoneyWeek team, to help you understand what really matters when it comes to your finances.
MoneyWeek is written by a team of experienced and award-winning journalists, plus expert columnists. As well as daily digital news and features, MoneyWeek also publishes a weekly magazine, covering investing and personal finance. From share tips, pensions, gold to practical investment tips - we provide a round-up to help you make money and keep it.
-
 Average UK house price reaches £300,000 for first time, Halifax says
While the average house price has topped £300k, regional disparities still remain, Halifax finds.
-
 Barings Emerging Europe trust bounces back from Russia woes
Barings Emerging Europe trust has added the Middle East and Africa to its mandate, delivering a strong recovery, says Max King

