Good news for gold bulls - it could be time to start buying again
Some people are starting to think that gold's bull market is over. But Dominic Frisby disagrees. Here, he looks back at gold's historical performance, and concludes that now might just be the time to get buying again.
Get the latest financial news, insights and expert analysis from our award-winning MoneyWeek team, to help you understand what really matters when it comes to your finances.
You are now subscribed
Your newsletter sign-up was successful
Want to add more newsletters?

Twice daily
MoneyWeek
Get the latest financial news, insights and expert analysis from our award-winning MoneyWeek team, to help you understand what really matters when it comes to your finances.

Four times a week
Look After My Bills
Sign up to our free money-saving newsletter, filled with the latest news and expert advice to help you find the best tips and deals for managing your bills. Start saving today!
The website www.sharelynx.com is a treasure trove of weird and wonderful charts, most of them gold-related.
It's the only site I know where you can find the historical ratio of gold-to-milk prices, for example. Or where you can look at a measure of sentiment in the gold market from, say, 1983.
Nick Laird, who runs the site, pinged me an email last week, which read: "This must be the low. I have rarely seen it so quiet. Normally I get at least a couple of visitors a day looking for a trial of my website. The last ten days, I've had two people asking".
MoneyWeek
Subscribe to MoneyWeek today and get your first six magazine issues absolutely FREE

Sign up to Money Morning
Don't miss the latest investment and personal finances news, market analysis, plus money-saving tips with our free twice-daily newsletter
Don't miss the latest investment and personal finances news, market analysis, plus money-saving tips with our free twice-daily newsletter
This is following the (admittedly unreliable) contrarian principle of buying when others are fearful and selling when they're greedy.
So is this the low for gold? Well, I've been looking at some historical charts of gold, and they make me think that it just might be
Gold is in one of its consolidation phases
I don't know, of course, if this is the bottom for gold, and nor does anybody else. And if they tell you they do, well, caveat emptor.
I do, however, think there's a good chance we're making some kind of a low here. And I don't think now is a bad time to be accumulating.
Why now? I'll start by reminding you of my bigger picture view on gold a theory that so far has proved right. The bull market, which began in 2001, has seen average annual gains in gold of just below 20%, measured in US dollars (and slightly better in pounds).
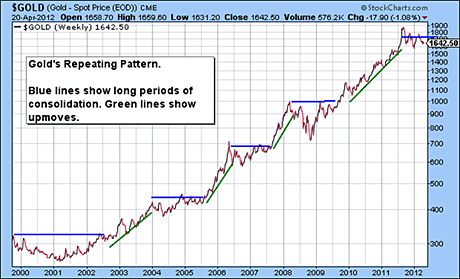
But every so often in this broader upward trend, gold has raced ahead of itself and enjoyed a mini-parabolic move.
This was particularly apparent in early 2006, when it moved from $550 in March to $720 an ounce by early May a 35% rise in just a couple of months. We saw a similar surge from December 2007. Gold began a move from $780 that ended a few months later in March 2008 at $1,033. This was another 35% move.
Every time gold has made one of these moves, a lengthy period of consolidation and digestion has followed before we have seen new highs. Often these periods last for more than a year. In some cases if the preceding move has been large the consolidation has lasted for over 18 months.
We saw another surge in 2011. Gold started the year at about $1,420. It sank to $1,309 by late January. It then began an upward move of almost 50% that ended in September at $1,920. It moved 30% alone in the two months from July to September.
Since then I've been saying that gold is likely to experience an extended period of consolidation, and that we won't see new highs before next autumn or winter at the earliest.
That seems to be just the phase we are in now a period of digestion. It's frustrating. Many are starting to suspect that gold's bull market may even be over. I maintain we will eventually see new highs, just not any time soon.
I've illustrated the stepping pattern I've described in the chart below.
For those who are feeling wobbly, the chart below (from Nick Laird at www.sharelynx.com) shows gold since 2001. There is a long-term trend line in green and we are sitting right on it. The light green band is potential variation within the broader upward trend. We could go as low as $1,300 and the broader trend would still be upward.
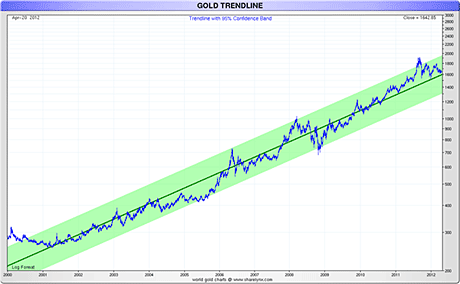
However, I'm not convinced that we'll go that low before the next big rally. Here's why.
This correction looks just like the one in 2006
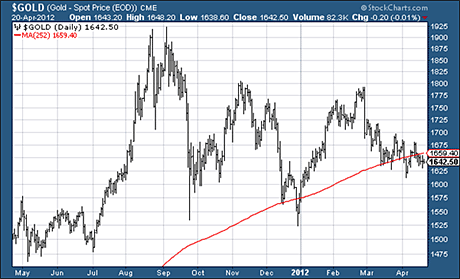
Now I want to show you two more charts that further demonstrate my theory. The first chart (below) shows gold over the past year.
We can see the mega 30% move from $1,480 in July 2011 from to $1,920 in September. Then there's the correction to $1,530 or so, followed by a bounce, then a retest of the low.
Now we have a period of meandering around the 252-day simple moving average the red line. (The average price of the past 252 trading days, ie one year).
Now I'm going to show you a one-year chart of the 2006 break-out and correction.
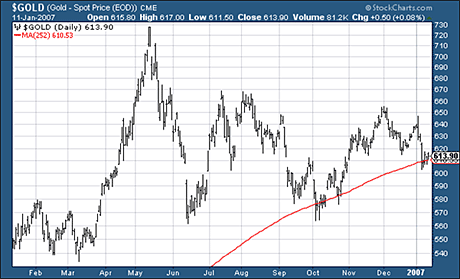
It's virtually identical. (And it's even more apparent with a simple line chart). The size of the gains and corrections in percentage terms, their durations, the pull-back to the 252-day moving average, the second re-test of the 252-dma they all mirror one another.
I think that says a great deal about gold investors and speculators, and the cycle of emotion that they go through, and the impact that has on their thought processes.
Now I'm going to show you a one-year chart, which begins on the day the above chart from 2006 ends.
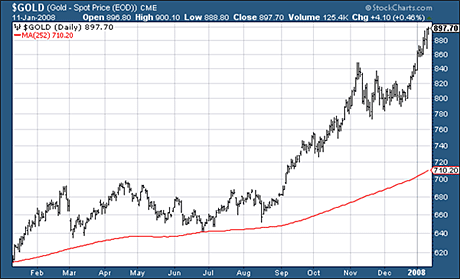
There was another nine months of consolidation albeit at slightly higher levels before gold broke above $720 and went on to make new highs. But this was a nice year to be invested in gold.
After that, of course, we had the drama of 2008.
So, to sum up, I see gold as still being in a period of post-September 2011 consolidation. I don't expect a break-out to new highs any time soon, though I am happy to be wrong on this.
However, if the patterns of previous moves continue to be our guide, we can expect gold to start creeping up from here perhaps to about $1,800 before a pullback. I would like to see gold get above its 252-day moving average and stay above it.
If it doesn't and gold starts to creep down, I will be nervous. But continue to hold your gold. The fundamentals have not changed. And if you don't own any, I would say the odds favour now as a decent opportunity to accumulate.
This article is taken from the free investment email Money Morning. Sign up to Money Morning here .
Our recommended articles for today
What the French election results mean for the euro
With the results of the first round of the French elections in, Matthew Partridge examines what they mean for Europe, the euro and your investments.
Three ways takeovers rip off shareholders
Takeovers are a great way for directors to look good - and hide the extent of their mistakes for years after, says Tim Bennett. Here's why we should all loathe takeovers.
Get the latest financial news, insights and expert analysis from our award-winning MoneyWeek team, to help you understand what really matters when it comes to your finances.
MoneyWeek is written by a team of experienced and award-winning journalists, plus expert columnists. As well as daily digital news and features, MoneyWeek also publishes a weekly magazine, covering investing and personal finance. From share tips, pensions, gold to practical investment tips - we provide a round-up to help you make money and keep it.
-
 Average UK house price reaches £300,000 for first time, Halifax says
While the average house price has topped £300k, regional disparities still remain, Halifax finds.
-
 Barings Emerging Europe trust bounces back from Russia woes
Barings Emerging Europe trust has added the Middle East and Africa to its mandate, delivering a strong recovery, says Max King

