The 'clear buy signal' that isn't
A key stock signal, the gilt/equity yield ratio, is flashing up "buy", so why should investors be wary? Tim Bennett explains
Get the latest financial news, insights and expert analysis from our award-winning MoneyWeek team, to help you understand what really matters when it comes to your finances.
You are now subscribed
Your newsletter sign-up was successful
Want to add more newsletters?

Twice daily
MoneyWeek
Get the latest financial news, insights and expert analysis from our award-winning MoneyWeek team, to help you understand what really matters when it comes to your finances.

Four times a week
Look After My Bills
Sign up to our free money-saving newsletter, filled with the latest news and expert advice to help you find the best tips and deals for managing your bills. Start saving today!
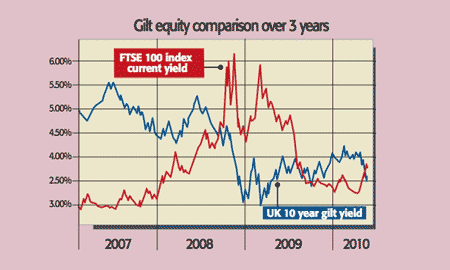
"The signal that says the market is cheap" is how the Motley Fool's Owain Bennallack describes the latest gilt/equity yield ratio (GEYR) reading. We aren't so sure: this ratio is important, but right now it doesn't give the all-clear to pile back into equities.
How it works
You just compare the dividend yield on the FTSE 100 with the yield available on ten-year gilts. When the yield on equities is higher than the yield on gilts, fans of the ratio say you get a clear buy signal. Typically the two numbers are compressed into one ratio by dividing the gilt yield into the equity yield. Anything below one is a buy.
Currently the ten-year gilt yield is around 3.5%, notes Bennallack, while the FTSE dividend yield is about 3.8%. That's a ratio of about 0.92 (3.5/3.8). Bingo. To reinforce how unusual this is, consider the fact that "for the past 50 years the GEYR has averaged nearer to 2 to 1". As Citigroup's Jonathan Stubbs notes in the FT, "on this basis equities are cheaper than they were at the lows in 2003". Indeed, they have only been cheaper on this measure in March 2009 just before the market began its last huge surge and "back in 1965".
MoneyWeek
Subscribe to MoneyWeek today and get your first six magazine issues absolutely FREE

Sign up to Money Morning
Don't miss the latest investment and personal finances news, market analysis, plus money-saving tips with our free twice-daily newsletter
Don't miss the latest investment and personal finances news, market analysis, plus money-saving tips with our free twice-daily newsletter
And as Bennallack concludes, since this is a mechanical signal, "you can't pick and choose" when it flashes "buy", you need a good reason not to do so.
Why it might work
Yields are a snapshot of the return available on an asset, expressed annually. So, put £100 into a bank account with an interest rate of, say, 6% and your annual yield (assuming the interest is all credited in one lump sum at the end of the year) is (6/100) x 100%, or 6%. So far so simple. However, other investments, such as gilts, don't just offer an income.

Yes, there is a semi-annual coupon, but you can also make a capital gain or loss. Buy a gilt for, say, £96 (per £100 fixed nominal value) and cash it in when it is redeemed by the UK Treasury for £100 and you make another £4 on top of any income you receive. Combine that with the pure income yield and you get what is called the total gross redemption yield.
That will rise as investors sell gilts and reinvest in, say, equities (simultaneously pushing share prices up and dividend yields down). And it'll fall as it has been doing recently when investors smell fear, dump equities and pile into the perceived safety of gilts. Buying pressure pushes prices up and yields down. As equities are sold the dividend yield (the annual expected dividend as a percentage of the price) will tend to rise. That's where the GEYR comes in. Over the long term the Barclays Equity Gilts study (and plenty of other similar sources too) reveals that equities hugely outperform gilts. So when sellers have forced prices down to the point where the yield beats that on gilts, shares look very cheap.
How you can be fooled
However, there are a number of reasons to be wary. First, as Bennallack concedes, although reasonably reliable, the ratio can give the wrong signal. For example, it flagged a buying opportunity in late 2008 "just before the demise of Lehman Brothers routed the market on its way to the bottom in March 2009".
The ratio may also be technically flawed
Some critics also think it compares apples and pears. As John Higgins at Capital Economics points out, "equities are real assets". So at the very least, "this suggests we ought to be comparing the dividend yield with the yield on index-linked gilts (which offer an inflation-linked return), rather than conventional gilts".
Another problem is that the dividend yield on shares is influenced by the expected real (after inflation) growth rate for equities. So the annual earnings yield on stocks (an annual earnings figure divided into the share price) is arguably a better guide to expected equity returns than dividend yields. Higgins concedes that even if you adjust the measure to take account of this, equities still do look reasonably cheap.
However, as he also points out, right now things are skewed by the fact that there is currently good reason for gilt yields to be low and to stay low, regardless of the movements of the equity markets.
For starters, gilt yields, and "particularly the yield on index-linked gilts" (which are in short supply, accounting for around 20% of total issuance), are likely to be structurally depressed by strong demand from pension funds. Long-term, inflation remains a worry and there are precious few ways for big fund managers to protect themselves against it. And that aside, "we expect real government bond yields to remain anchored by the prospect of a prolonged period of exceptionally low interest rates". In short, there are several good reasons why the gilt yield is so low and is likely to stay that way.
There are also very few reasons for equities to take off. Like Higgins, "we think the FTSE will end the year around the 5000 mark". So anyone expecting to make an easy buck from this deceptively simple market signal may be disappointed this time.
Get the latest financial news, insights and expert analysis from our award-winning MoneyWeek team, to help you understand what really matters when it comes to your finances.
Tim graduated with a history degree from Cambridge University in 1989 and, after a year of travelling, joined the financial services firm Ernst and Young in 1990, qualifying as a chartered accountant in 1994.
He then moved into financial markets training, designing and running a variety of courses at graduate level and beyond for a range of organisations including the Securities and Investment Institute and UBS. He joined MoneyWeek in 2007.
-
 Barings Emerging Europe trust bounces back from Russia woes
Barings Emerging Europe trust has added the Middle East and Africa to its mandate, delivering a strong recovery, says Max King
-
 How a dovish Federal Reserve could affect you
Trump’s pick for the US Federal Reserve is not so much of a yes-man as his rival, but interest rates will still come down quickly, says Cris Sholto Heaton