You are now subscribed
Your newsletter sign-up was successful
Want to add more newsletters?

Twice daily
MoneyWeek
Get the latest financial news, insights and expert analysis from our award-winning MoneyWeek team, to help you understand what really matters when it comes to your finances.

Four times a week
Look After My Bills
Sign up to our free money-saving newsletter, filled with the latest news and expert advice to help you find the best tips and deals for managing your bills. Start saving today!
Gold is dear to the hearts of many a trader. It is the most emotional of markets. By that I mean the basic supply/demand factors that have a big influence on most other markets seem to have little or no effect on gold prices. The market swings according to changes in sentiment.
We all know that global tensions have been riding high recently, with conflicts in Ukraine and Gaza to cite only two. The Ukraine conflict should have a major impact on gold prices because it involves Russia, which remains a loose cannon in the eyes of many decision makers in the West. And it holds a few aces, in the form of oil and gas supplies.
MoneyWeek
Subscribe to MoneyWeek today and get your first six magazine issues absolutely FREE

Sign up to Money Morning
Don't miss the latest investment and personal finances news, market analysis, plus money-saving tips with our free twice-daily newsletter
Don't miss the latest investment and personal finances news, market analysis, plus money-saving tips with our free twice-daily newsletter
On Wednesday, I showed that the $1,275 low lay on the long-term support line. I expected some sort of bounce up from there. That forecast did not require much thoughtful analysis!
But I asked the question: does the budding rally have legs?
This was the hourly chart on Wednesday morning:
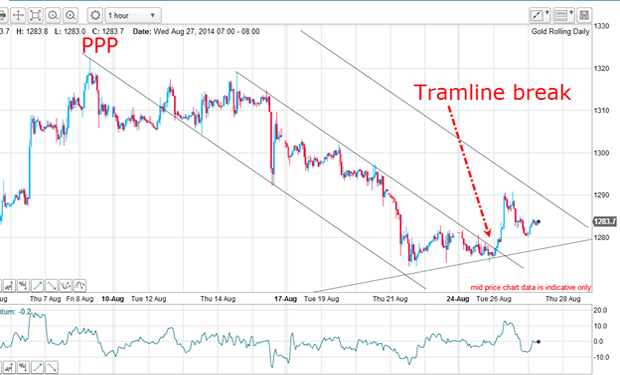
I had a superb tramline pair and a third tramline as my first target. This is what I wrote: "If gold can reach my third tramline, I will be watching to check how the market reacts to this line of resistance."
I did not have to wait very long to see my target hit. But the crucial thing was how the market would react after the hit. This is the updated hourly:

Right on cue, the market made it to the third tramline target, briefly backed off that line of resistance and then powered through it in short order.
This action told me that the rally almost certainly has stronger legs than I had first anticipated.
And according to my tramline trading rule, a long trade was offered on that break. And the protective stop? An excellent place was under the support shelf at the $1,280 level. A break there would probably mean the rally was failing and to look for a re-test of the $1,275 lows.
Two possible low-risk trades
So I had two possible low-risk long entries on the break of the centre and third tramlines. The first entry in the $1,278 area was protected by a stop loss which I can now move to break even following my rule. This gives me a worst-case scenario of a wash trade if the market suddenly declines again.
This is peace-of-mind trading a state I encourage all traders to adopt. Why? Because your judgment is off-balance when you're under stress. To make well-balanced trading decisions, you need to be in a relative comfort zone, mentally.
Yesterday the rally intensified, but where did it reach?

As a very convincing demonstration of why you should always use Fibonacci in your work, the market made a precise hit on the Fibonacci 50% retrace of the big wave down off the $1,320 high. Not only that, but the previous rally carried to the exact 38% level! That is straight out of the textbook.
And note that the high and low pivot points for my Fibonacci levels were both on very brief spike moves, especially the high. But the market remembered those extreme high and low prices and enabled my Fibonacci levels to become levels of resistance to rallies. Markets have very accurate memories.
The big question is will the rally extend? The move off the lows has an A-B-C feel to it and there is a small negative-momentum divergence at yesterday's high.
If it can overcome these limitations, the next target becomes the 62% retrace in the $1,300 area. Otherwise, a decline to try a kiss on the third tramline is possibly on the cards.
In a sense, it doesn't really concern me where the market goes from here since my trades are well protected by a disciplined use of stops. That is all I can do now, while I sit and observe the waves unfold.
-
 ISA fund and trust picks for every type of investor – which could work for you?
Whether you’re an ISA investor seeking reliable returns, looking to add a bit more risk to your portfolio or are new to investing, MoneyWeek asked the experts for funds and investment trusts you could consider in 2026
-
 The most popular fund sectors of 2025 as investor outflows continue
It was another difficult year for fund inflows but there are signs that investors are returning to the financial markets

