Will this be a big year for the dollar?
The pound is running out of steam against the dollar, says John C Burford. This could be a big year for the greenback.
Get the latest financial news, insights and expert analysis from our award-winning MoneyWeek team, to help you understand what really matters when it comes to your finances.
You are now subscribed
Your newsletter sign-up was successful
Want to add more newsletters?

Twice daily
MoneyWeek
Get the latest financial news, insights and expert analysis from our award-winning MoneyWeek team, to help you understand what really matters when it comes to your finances.

Four times a week
Look After My Bills
Sign up to our free money-saving newsletter, filled with the latest news and expert advice to help you find the best tips and deals for managing your bills. Start saving today!
On Wednesday, I posted an interesting chart on the GBP/USD and marked my line in the sand'. I suggested that if this line can be broken to the downside it would act as resistance instead of support.
This is what I wrote: "In the last few days, this line has held all attempts to break down through it. But a downward break would be significant. There are bound to be many sell-stops placed there by the bulls (who outnumber the bears by about two-to-one)".
This was the chart on Wednesday:
MoneyWeek
Subscribe to MoneyWeek today and get your first six magazine issues absolutely FREE

Sign up to Money Morning
Don't miss the latest investment and personal finances news, market analysis, plus money-saving tips with our free twice-daily newsletter
Don't miss the latest investment and personal finances news, market analysis, plus money-saving tips with our free twice-daily newsletter
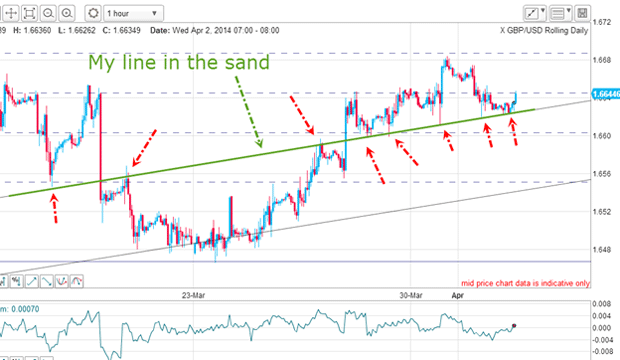
The sheer number of accurate touch points is impressive over this two week period. What I didn't point out (and eagle-eyed readers would have seen) was the budding small negative-momentum divergence at Monday's high. This was an early warning that buying power was running out of steam and that the next challenge of my line could be successful.
And right on cue, the market made a clean break of my line yesterday. The move was sharp and was undoubtedly enhanced when the sell-stops I mentioned were set off.
The one pattern I always watch for
That is a general rule I always observe.
However, this is not always obeyed. That is when we see the notorious head fake!
Naturally, a trader could have placed an entry sell-stop just below the line to catch the break to position short. And with a protective buy-stop entered just above the line to catch a possible reversal, a low-risk trade resulted.
Do we have a new downtrend?
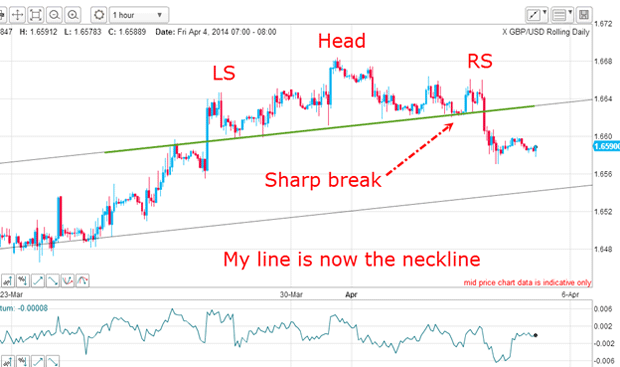
The break of my line in the sand has now set up a very clear head and shoulders pattern!
This is a pattern that is well established over many years as a reversal pattern.And that would mean this pattern is pointing to a declining market.
But so far, the decline off the 1.6680 high is in only three waves, so caution is advisable here. This could turn out to be a corrective A-B-C pattern, leading to new highs.
This is the question: Do we really have a new downtrend?
One way to find the answer is to look at another related market that can shed more light on this question.
How to determine the trend
Here is the EUR/USD:
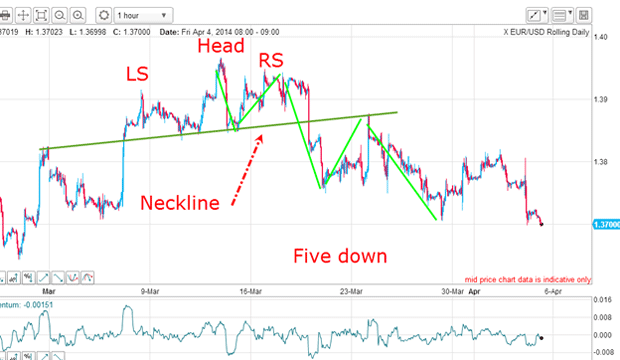
There is a clear head and shoulders pattern here also, but it occurs a few days earlier than in cable.
The neckline is also reliable, since it has the two outer touch points where it acted as resistance. Inside the head and shoulders pattern, it acted as support. Remember markets have memories.
But here's the crucial point - I can count five waves down (the green lines in the chart above). Here they are again:
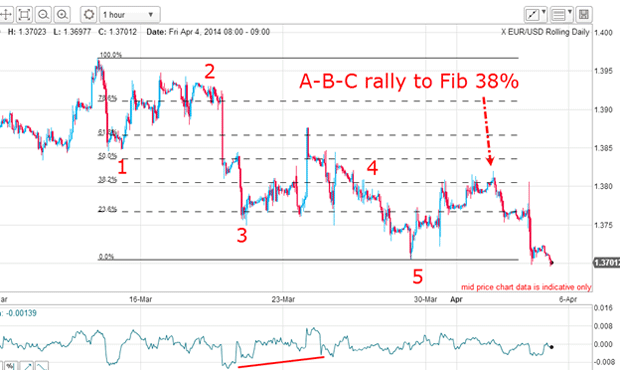
I have a very strong thrust down in wave 3, a complex wave 4 (this is typical), and the clincher a large positive-momentum divergence at the wave 5 low.
This is textbook Elliott wave behaviour. But that is not all. After five impulsive waves down, we should see an A-B-C corrective rally and that is what we got with the rally carrying to the Fibonacci 38% retracement.
This morning, the market is edging into new lows for the move below the wave 5 low. This confirms the message from the head and shoulders pattern that the trend is down.
We also have an impulsive five-wave move down off the high, and those are the two key clues that the trend has changed.
With this information, the trend in GBP/USD is also very likely down, and the A-B-C correction picture becomes less likely.
The year of the dollar
But if the main trend is now down, are there any lower targets I can see?
Here is my wedge on the daily chart:
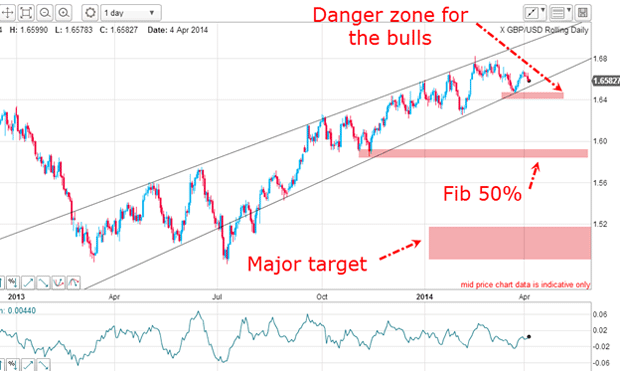
The first danger zone for the bulls is a break of the lower wedge line and break of the last major low just above the 1.64 level.
Then, a Fibonacci 50% retrace of the entire rally from last summer would produce another target at the1.58 1.59 area.
Finally, a complete retrace of the wedge rally would take the market to the 1.50 1.52 area. If this is reached, that means a decline of 16 cents, or a profit of £16,000 for each £1 spread bet. As is often said, this beats the building society!
Naturally, as trading progresses, new patterns will be forming and I will be covering these in my posts as they develop.
This year is shaping up to be the year of the dollar (contrary to most forecasts, of course).
Get the latest financial news, insights and expert analysis from our award-winning MoneyWeek team, to help you understand what really matters when it comes to your finances.
John is is a British-born lapsed PhD physicist, who previously worked for Nasa on the Mars exploration team. He is a former commodity trading advisor with the US Commodities Futures Trading Commission, and worked in a boutique futures house in California in the 1980s.
He was a partner in one of the first futures newsletter advisory services, based in Washington DC, specialising in pork bellies and currencies. John is primarily a chart-reading trader, having cut his trading teeth in the days before PCs.
As well as his work in the financial world, he has launched, run and sold several 'real' businesses producing 'real' products.
-
 Average UK house price reaches £300,000 for first time, Halifax says
While the average house price has topped £300k, regional disparities still remain, Halifax finds.
-
 Barings Emerging Europe trust bounces back from Russia woes
Barings Emerging Europe trust has added the Middle East and Africa to its mandate, delivering a strong recovery, says Max King