Learn from the world’s greatest ‘tape worm’ trader
Jesse Livermore's famous biography is required reading for traders, says John C Burford - not least when trading the pound.
Get the latest financial news, insights and expert analysis from our award-winning MoneyWeek team, to help you understand what really matters when it comes to your finances.
You are now subscribed
Your newsletter sign-up was successful
Want to add more newsletters?

Twice daily
MoneyWeek
Get the latest financial news, insights and expert analysis from our award-winning MoneyWeek team, to help you understand what really matters when it comes to your finances.

Four times a week
Look After My Bills
Sign up to our free money-saving newsletter, filled with the latest news and expert advice to help you find the best tips and deals for managing your bills. Start saving today!
Reminiscences of a Stock Operator is the autobiography of Jesse Livermore, one of the most colourful stock and commodity market speculators of his day. He operated in the early 20th century when technology was still quite primitive.
Back then, the ticker tape had just been introduced and speculators would read the tape' as it spewed out of the machine in much the same way as we pore over our screens. Avid tape readers were dubbed tape worms'.
I've been re-reading this classic book and on almost every page there are nuggets of wisdom that traders can apply today. It's one of the reasons this is often called the best book on trading bar none.
MoneyWeek
Subscribe to MoneyWeek today and get your first six magazine issues absolutely FREE

Sign up to Money Morning
Don't miss the latest investment and personal finances news, market analysis, plus money-saving tips with our free twice-daily newsletter
Don't miss the latest investment and personal finances news, market analysis, plus money-saving tips with our free twice-daily newsletter
Here is just one quote:"my system for placing my bets... is simple arithmetic to prove that it is a wise thing to have the big bet down only when you win, and when you lose to lose only a small exploratory bet if a man trades in this way he will always be in the profitable position of being able to cash in on the big bet".
That actually sums up my low-risk approach, my 3% rule and split bet strategy very nicely!
The book outlines Livermore's journey from starting out as a novice to becoming a professional operator with all of the highs and lows along the way.
I cannot recommend this book highly enough I try to re-read it at least once a year, and every time I do, I glean more insights than before. Today, I want to share some of those with you.
Don't put the cart before the horse
That is an approach that hasn't changed in a hundred years! So many speculators believe that a study of what Livermore calls general conditions' (or the fundamentals) is enough to put them on the right side of the market.
Sadly, experience says that this is like putting the cart before the horse.
My approach is the opposite: determine the trend first and then act. The fundamentals will follow - if the trend is genuine.
One classic recent example is gold. Prior to October 2011, the fundamentals were pointing in the bullish direction. But then after the famous $1,920 top was in, the market fell heavily with no apparent change in the fundamentals.
It was only when gold was trading several hundred dollars lower that a new fundamental story emerged to seemingly justify the decline.
How to determine the trend
Here is latest commitments of traders (COT) data:
| (Contracts of GBP 62,500) | Row 0 - Cell 1 | Row 0 - Cell 2 | Row 0 - Cell 3 | Open interest: 202,115 | ||||
| Commitments | ||||||||
| 66,751 | 37,027 | 2,687 | 102,280 | 144,695 | 171,718 | 184,409 | 30,397 | 17,706 |
| Changes from 03/18/14 (Change in open interest: -6,846) | ||||||||
| 2,610 | -1,578 | 383 | -7,165 | -4,133 | -4,172 | -5,328 | -2,674 | -1,518 |
| Percent of open in terest for each category of traders | ||||||||
| 33.0 | 18.3 | 1.3 | 50.6 | 71.6 | 85.0 | 91.2 | 15.0 | 8.8 |
| Number of traders in each category (Total traders: 107) | ||||||||
| 37 | 23 | 8 | 28 | 30 | 68 | 58 | Row 8 - Cell 7 | Row 8 - Cell 8 |
Last week, both hedge funds (non-commercials) and small traders (non-reportables) reduced their shorts and increased their longs. That means they now hold approximately two longs for every one short.
As I have documented for a long time, it is when most traders have flocked to one side of the boat that it is in danger of capsizing. I am always on the lookout for this kind of event, because it can provide a very swift and profitable move in the opposite direction.
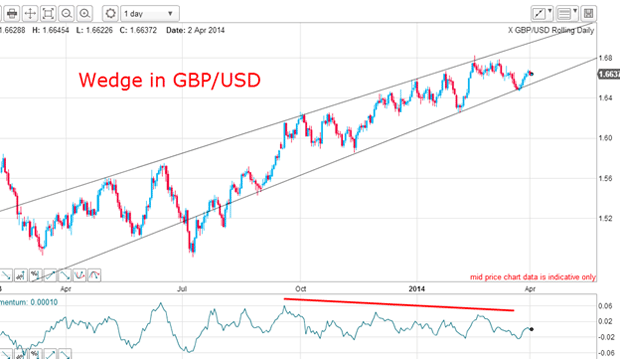
Here is the daily chart showing the long-established wedge pattern I have been following:

The upper line has several accurate touch points with the stand-out overshoot above 1.68 on 17 February. This marked the high (so far) and is characteristic of overshoots, since they often signify a buying exhaustion.
The lower line also has many accurate touch points, marking it as a significant line of support. Breaking this line would likely produce a cascade of selling, which is what I am looking for. The wedge has contained all trading over the past six months, and so a break would likely be a major event.
Also of note is the gradual weakening of buying pressure indicated by the long-lived negative-momentum divergence.
What to do when the trend is changing
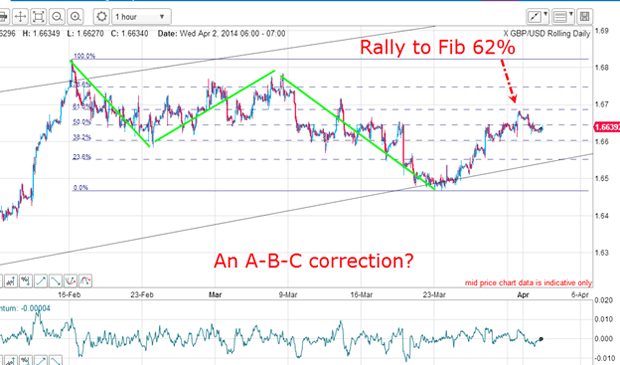
Here is the hourly:

The move off the 1.68 high can be said to be an A-B-C correction (green lines), implying the main trend remains up. But the rally off the 23 March low has carried to the Fibonacci 62% retrace a typical reversal point for a correction.
So there is a tug-of-war going on now between these opposing forces.
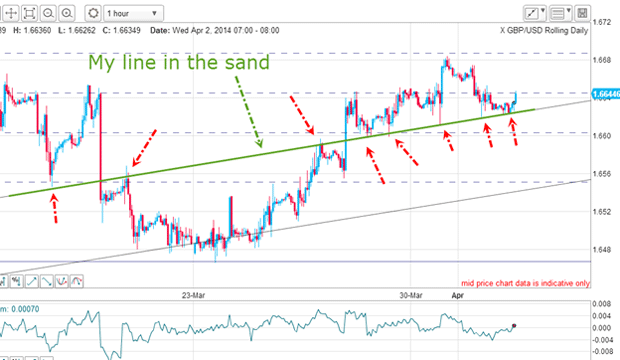
Let's now take a closer look on the hourly:

I have drawn in a major line of support/resistance. Note the alternate regions of support and then resistance of this line over a two-week period.
I am calling this my line on the sand'. Note that it runs parallel to my lower wedge line, making a neat tramline pair!
In the last few days, this line has held all attempts to break down through it. But a downward break would be significant. There are bound to be many sell-stops placed there by the bulls (who out-number the bears by about two-to-one).
If the market can break down from here, it would be a major event. But unlike the early Livermore, it is best to wait for the market to tell us what it wants to do and then act. That is putting the horse before the cart - and it will have you off and running in the right direction.
Get the latest financial news, insights and expert analysis from our award-winning MoneyWeek team, to help you understand what really matters when it comes to your finances.
John is is a British-born lapsed PhD physicist, who previously worked for Nasa on the Mars exploration team. He is a former commodity trading advisor with the US Commodities Futures Trading Commission, and worked in a boutique futures house in California in the 1980s.
He was a partner in one of the first futures newsletter advisory services, based in Washington DC, specialising in pork bellies and currencies. John is primarily a chart-reading trader, having cut his trading teeth in the days before PCs.
As well as his work in the financial world, he has launched, run and sold several 'real' businesses producing 'real' products.
-
 UK interest rates live: rates held at 3.75%
The Bank of England’s Monetary Policy Committee (MPC) met today to decide UK interest rates, and voted to hold rates at their current level
-
 MoneyWeek Talks: The funds to choose in 2026
Podcast Fidelity's Tom Stevenson reveals his top three funds for 2026 for your ISA or self-invested personal pension