Market ‘roadmap’ says Dow could slump to 12,000
With all the bearish action lately, markets are moving down in synch. And the outlook for the Dow is for further big falls, says John C Burford. Here, he identifies two possible trading targets.
Get the latest financial news, insights and expert analysis from our award-winning MoneyWeek team, to help you understand what really matters when it comes to your finances.
You are now subscribed
Your newsletter sign-up was successful
Want to add more newsletters?

Twice daily
MoneyWeek
Get the latest financial news, insights and expert analysis from our award-winning MoneyWeek team, to help you understand what really matters when it comes to your finances.

Four times a week
Look After My Bills
Sign up to our free money-saving newsletter, filled with the latest news and expert advice to help you find the best tips and deals for managing your bills. Start saving today!
Last Wednesday's MoneyWeek Trader on the Dowcould not have been more timely.
Starting from the 19 June 12,900 high, the market has moved down by 300 pips in only four trading days.
But if you saw that article on Wednesday, you'll recall that I had two clear options: the first was a further rally extension towards the 13,000 area, and the second was a big move down.
MoneyWeek
Subscribe to MoneyWeek today and get your first six magazine issues absolutely FREE

Sign up to Money Morning
Don't miss the latest investment and personal finances news, market analysis, plus money-saving tips with our free twice-daily newsletter
Don't miss the latest investment and personal finances news, market analysis, plus money-saving tips with our free twice-daily newsletter
I based these projections on a combination of my use of the Elliott waveprinciple and Fibonacciretracements.
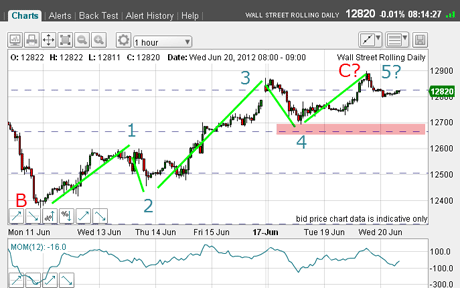
This was the chart on Wednesday:

(Click on the chart for a larger version)
I had my clear five waves up to my suggested C wave top. This rested around the Fibonacci 62% retrace of the entire May decline. That gave me a strong case for my bearish view, as a complete five waves up implies a downside reversal ahead.
The Dow paused and then slumped on Fed news
Following the much-anticipated US Fed announcement last Wednesday, the market thought about it for a day.
Then it decided it didn't like what Ben had said, and promptly sold off heavily, moving through my sell-stop levels.
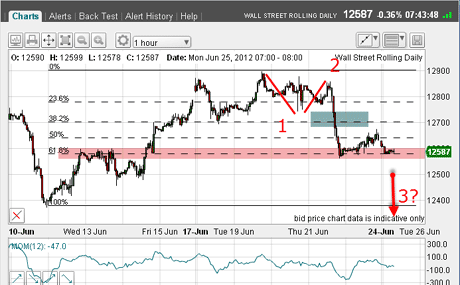
Here's the updated chart as of this morning:

(Click on the chart for a larger version)
From the Wednesday top, the market moved down in wave 1, then bounced, but not to a new high in wave 2, and fell heavily on Thursday. This decline has all the hallmarks of a third wave, being long and strong'.
After Friday's bounce there could be further falls ahead
You can see how the market stalled at the Fibonacci 62% retrace of the rally with a small bounce on Friday. That's to be expected at this important Fibonacci level.
But if we are in a genuine third wave, rallies should be brief before new lows are plumbed.
That's one of the great benefits of using Elliott wave principles. It gives you a definite roadmap ahead based on your suggested wave count.
I have projected a heavy decline based on what third waves look like. But if the market suddenly reverses and rallies strongly, then I know my wave labels are wrong, and I will probably abandon my trade.
Remember: Hope is no basis on which to trade these markets.
In fact, Bob Prechter of Elliott Wave International has a handy phrase for bear markets: While bull markets climb a 'wall of worry', bear markets slide down a 'slope of hope'.
Last week, the hope was that the Fed would come in with more quantitative easing (QE) to prop up stock markets after all, that has been their declared intent on previous QE operations. It was a classic case of 'Buy the rumour, sell the news'.
OK, on the chart I have marked with a grey bar the area where short trades could have been made.
These sell orders could have been placed beforehand, of course, and orders would have been filled on Thursday.
Trader tip: As a low-stress way of trading, if you can identify a price on the chart where you would like to enter, as here, then setting a stop order' in advance makes a lot of sense. It avoids the time-consuming need to constantly monitor markets, waiting for that opportunity (which may never come!)
It allows you to plan your trade. And when you are filled, you can then go in and set your protective stops and then manage your trade in the usual way. Refer to your spread betting company's dealing guide for the different types of order.
My two possible targets for a downside move
So now, with the bearish action late last week, the Dow, gold, and the EUR/USD are moving down in synch.
Remember, this is what we should expect, since it is liquidity that is driving asset markets.
My next target for the Dow is the 11 June low at the 12,400 area, but if my Elliott wave labels are correct, I have my sights on the 4 June low at 12,000.
At some stage, I will be looking for tramlines on this down-move. But since we are in its early phase, there is nothing there for me just yet. I will publish my tramline analysis as and when.
But if you can identify tramlines, then let me know!
If you're a new reader, or need a reminder about some of the methods I refer to in my trades, then do have a look at my introductory videos:
The essentials of tramline trading
An introduction to Elliott wave theory
Advanced trading with Elliott waves
Don't miss my next trading insight. To receive all my spread betting blog posts by email, as soon as I've written them, just sign up here .
Get the latest financial news, insights and expert analysis from our award-winning MoneyWeek team, to help you understand what really matters when it comes to your finances.
John is is a British-born lapsed PhD physicist, who previously worked for Nasa on the Mars exploration team. He is a former commodity trading advisor with the US Commodities Futures Trading Commission, and worked in a boutique futures house in California in the 1980s.
He was a partner in one of the first futures newsletter advisory services, based in Washington DC, specialising in pork bellies and currencies. John is primarily a chart-reading trader, having cut his trading teeth in the days before PCs.
As well as his work in the financial world, he has launched, run and sold several 'real' businesses producing 'real' products.
-
 How should a good Catholic invest? Like the Vatican’s new stock index, it seems
The Vatican Bank has launched its first-ever stock index, championing companies that align with “Catholic principles”. But how well would it perform?
-
 The most single-friendly areas to buy a property
There can be a single premium when it comes to getting on the property ladder but Zoopla has identified parts of the UK that remain affordable if you aren’t coupled-up