Is the top in for the Dow?
Buoyed by hopes of more money printing, the Dow pulled off a surprise rally. But is the market about to turn? John C Burford turns to the charts for clues.
Get the latest financial news, insights and expert analysis from our award-winning MoneyWeek team, to help you understand what really matters when it comes to your finances.
You are now subscribed
Your newsletter sign-up was successful
Want to add more newsletters?

Twice daily
MoneyWeek
Get the latest financial news, insights and expert analysis from our award-winning MoneyWeek team, to help you understand what really matters when it comes to your finances.

Four times a week
Look After My Bills
Sign up to our free money-saving newsletter, filled with the latest news and expert advice to help you find the best tips and deals for managing your bills. Start saving today!
On Monday I set out my case for a big fall in the Dow.
And then yesterday, the US market staged a 95-point rally. So have I changed my view? Read on and I'll show you what I think's happening.
By the way, two of my other favourite markets to trade the euro and gold - are also at critical junctures, and I'll cover one or the other on Friday.
MoneyWeek
Subscribe to MoneyWeek today and get your first six magazine issues absolutely FREE

Sign up to Money Morning
Don't miss the latest investment and personal finances news, market analysis, plus money-saving tips with our free twice-daily newsletter
Don't miss the latest investment and personal finances news, market analysis, plus money-saving tips with our free twice-daily newsletter
But with political developments coming thick and fast, let's stick with the Dow today. The charts are throwing up some valuable lessons that you can use to improve your trading.
Why this Fibonacci level could be important
Of course, all eyes are on the Fed right now. Later today, we'll know what attitude Bernanke and Co are taking towards policy action if any in the face of a deteriorating US economy. Given the Dow's new bear market rally high yesterday, the market clearly believes more quantitative easing (QE) in some form is on the way.
But we're interested in the charts. So let's see what they're telling me now.
Well, because of yesterday's rally extension, I've had to modify my Elliott wave labels somewhat. I'll get to this a little later.
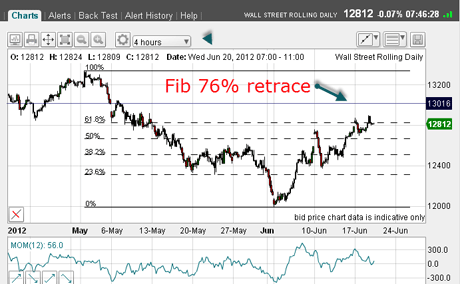
First, let's take a step back and re-examine the bigger picture to see if anything fundamental has changed in my analysis. Here is the four-hour chart taking in the 1 May 13,330 fifth-wave top:

(Click on the chart for a larger version)
From the 4 June 12,000 low, the rally still has an A-B-Cformat (so far), but now, the C wave is a little more complicated than I showed in Monday's post.
Looking at the Fibonacci levels on this rally, the market has poked above the 62% level and seems to be toying with it. Note that on the A wave top on Monday, we had a similar poke above the 50% level before selling drove the market back down.
Will the pattern be repeated here? If not, the market could stage a further advance perhaps to the Fibonacci 76% retrace in the 13,000 area. This could be initiated by a bullish' Fed announcement today.
Keep an eye on the T-Bond market
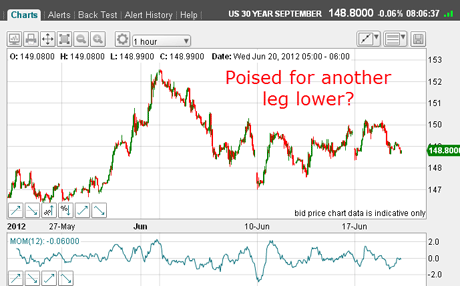
Interestingly, the US Treasury market appears unconcerned by a possible extension of the Fed monetising national debt. Take a look at this hourly chart of the September T-Bond:

(Click on the chart for a larger version)
The 4 June high at 152.5 occurred at the same time that the Dow low was being made, and the recent consolidation appears to have corrected the5.5 handle decline and may be ready for the next leg down.
If so, this could be accompanied by a Dow rally to my Fibonacci 76% retrace, as T-Bonds and the Dow move in an anti-sync manner.
So, my eyes will be firmly on the Treasury market as well as on the Dow this week.
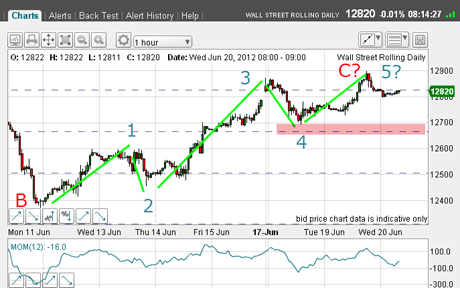
OK, now let's zoom in to the Dow chart and see what the small-scale picture can tell us. Here is the hourly chart showing my C wave:

(Click on the chart for a larger version)
Last time, I had my C wave high at Monday's high, but now I can place the C? wave top at yesterday's high which makes the new labelling just as good as before.
Here's my ideal scenario for the Dow
So there are two options in the near term, it seems to me
The first is for a rally beyond the 62% level towards the 13,000 area at the 76% Fib retrace. That might be an excellent place for me to look to short.
The second is for the 62% level to hold and a decline to take it down towards the support at my pink bar. A break here should confirm the top is in and we are at the early stages of a large third wave down.
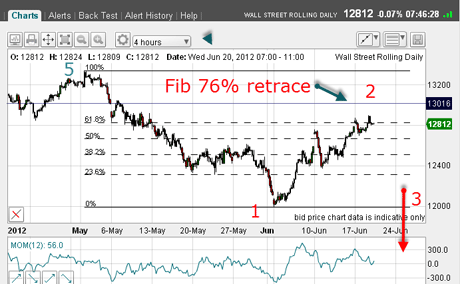
This is what my ideal scenario now looks like:

(Click on the chart for a larger version)
The large wave 1 lies at the 12,000 low and I am still looking for confirmation of the wave 2 top. But when it is in place, wave 3 down should be spectacular, and that is why I am willing to try to establish an early position in anticipation.
Trader tip: When attempting to pick market tops or bottoms, sometimes my first attempt is wrong and I must keep looking. But the rewards will often be well worth the attempts! But you may be of a different disposition where you need to be more certain that a new trend is in place before pulling the trigger. You will often pay a price for this insurance', as your protective stops will necessarily be wider. It's horses for courses again.
By the way, the other feature of this wave 2 rally is that it is taking the form of an up-sloping wedge, and these usually resolve downwards.
So this morning, the market has options. Later today, many of my questions should be answered, I'm quite sure. But watch the Treasuries they hold the key.
Before I sign off, let me leave you with this thought
I note that, whenever the Fed has made a QE or Operation Twist announcement, the market has invariably peaked and heavy selling has ensued. Will today be any different? Let's wait and see!
Thrilling times we're in, aren't they? Share your thoughts below.
If you're a new reader, or need a reminder about some of the methods I refer to in my trades, then do have a look at my introductory videos:
The essentials of tramline trading
An introduction to Elliott wave theory
Advanced trading with Elliott waves
Don't miss my next trading insight. To receive all my spread betting blog posts by email, as soon as I've written them, just sign up here .
Get the latest financial news, insights and expert analysis from our award-winning MoneyWeek team, to help you understand what really matters when it comes to your finances.
John is is a British-born lapsed PhD physicist, who previously worked for Nasa on the Mars exploration team. He is a former commodity trading advisor with the US Commodities Futures Trading Commission, and worked in a boutique futures house in California in the 1980s.
He was a partner in one of the first futures newsletter advisory services, based in Washington DC, specialising in pork bellies and currencies. John is primarily a chart-reading trader, having cut his trading teeth in the days before PCs.
As well as his work in the financial world, he has launched, run and sold several 'real' businesses producing 'real' products.
-
 MoneyWeek Talks: The funds to choose in 2026
Podcast Fidelity's Tom Stevenson reveals his top three funds for 2026 for your ISA or self-invested personal pension
-
 Three companies with deep economic moats to buy now
Opinion An economic moat can underpin a company's future returns. Here, Imran Sattar, portfolio manager at Edinburgh Investment Trust, selects three stocks to buy now