Will gold’s rallying comeback continue?
Gold is in full-on rally mode, but can it keep going? John C Burford applies his Fibonacci method to the charts to find out.
Get the latest financial news, insights and expert analysis from our award-winning MoneyWeek team, to help you understand what really matters when it comes to your finances.
You are now subscribed
Your newsletter sign-up was successful
Want to add more newsletters?

Twice daily
MoneyWeek
Get the latest financial news, insights and expert analysis from our award-winning MoneyWeek team, to help you understand what really matters when it comes to your finances.

Four times a week
Look After My Bills
Sign up to our free money-saving newsletter, filled with the latest news and expert advice to help you find the best tips and deals for managing your bills. Start saving today!
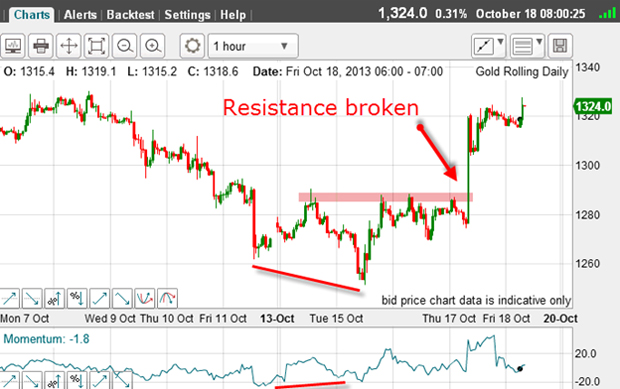
On Friday, I showed that the big rally late in the week was a short squeeze, and also that the positive-momentum divergence at the Tuesday low was a warning signal for the bears:

The red bars highlight this divergence, while the move above the pink resistance bar confirmed the rally.
It is worth looking at this action in more detail because it illustrates how, even today, classic chart patterns can still help you forge a reliable forecast.
MoneyWeek
Subscribe to MoneyWeek today and get your first six magazine issues absolutely FREE

Sign up to Money Morning
Don't miss the latest investment and personal finances news, market analysis, plus money-saving tips with our free twice-daily newsletter
Don't miss the latest investment and personal finances news, market analysis, plus money-saving tips with our free twice-daily newsletter
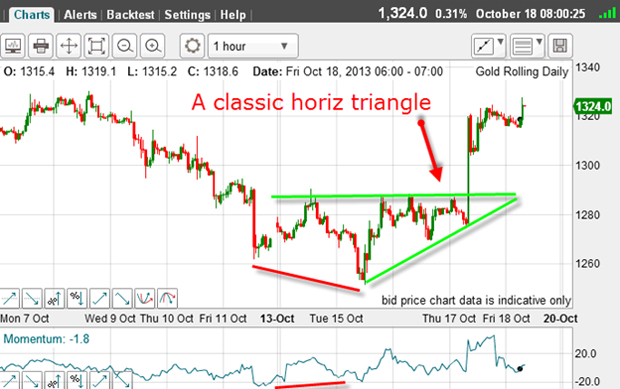
Note that this resistance zone has several tops where the market had attempted to push above it but was bounced back down.
This set up a classic horizontal triangle:

The market had then finally moved above the horizontal line of resistance, which was an excellent place to set entry buy stops.
If you did that, you would not have been alone, as chart-reading shorts would have placed their protective buy stops there as well.
Incidentally, gold can move very swiftly as it runs through stops. In fact, it can move $10 or more in the blink of an eye! That is why I would use stop orders at times like these.
Will this rally keep going?
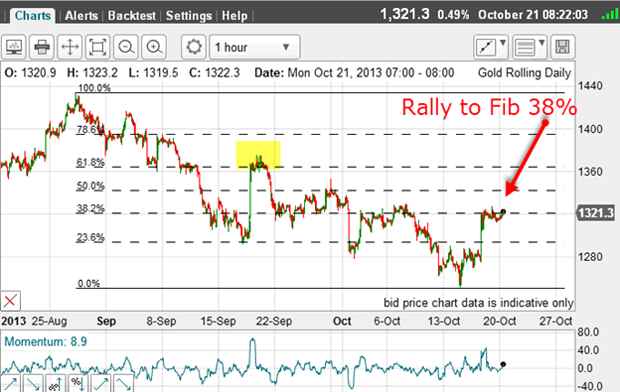
On Friday, I noted that the market had carried to the Fibonacci 38% retrace of the entire move down off the 28 August high of $1,430.

But when we have a large swing down that has lasted almost two months, I like to see what other Fibonacci relationships exist with the major highs that were set on the way down.
I have highlighted a major top. It really stands out, doesn't it?
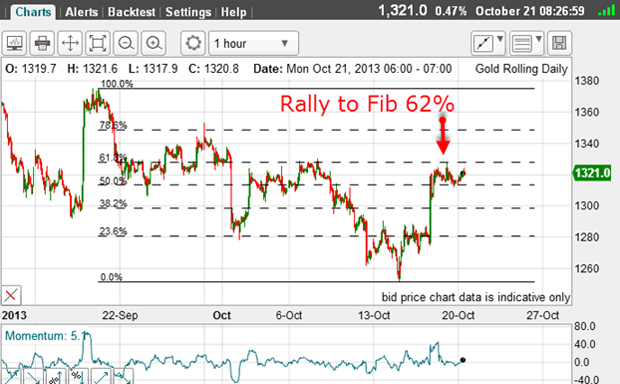
So let's apply the Fibonacci levels to the decline from this level:

On Friday, the market touched the $1,328 area bang on the Fibonacci 62% retrace. Isn't that pretty?
How to determine the strength of a resistance level
This resistance should prove stiff and a hefty barrier to further advances.
So you can see how I combine several Fibonacci pivot points to determine the strength of any particular resistance level.
In this case, I have two lines of Fibonacci resistance at the $1,328 level.
This is invaluable information.
But if the market can somehow punch up through this level, the next stop should be another Fibonacci level in the $1,350 region.
But this morning, this resistance appears solid.
Get the latest financial news, insights and expert analysis from our award-winning MoneyWeek team, to help you understand what really matters when it comes to your finances.
John is is a British-born lapsed PhD physicist, who previously worked for Nasa on the Mars exploration team. He is a former commodity trading advisor with the US Commodities Futures Trading Commission, and worked in a boutique futures house in California in the 1980s.
He was a partner in one of the first futures newsletter advisory services, based in Washington DC, specialising in pork bellies and currencies. John is primarily a chart-reading trader, having cut his trading teeth in the days before PCs.
As well as his work in the financial world, he has launched, run and sold several 'real' businesses producing 'real' products.
-
 UK interest rates live: rates held at 3.75%
The Bank of England’s Monetary Policy Committee (MPC) met today to decide UK interest rates, and voted to hold rates at their current level
-
 MoneyWeek Talks: The funds to choose in 2026
Podcast Fidelity's Tom Stevenson reveals his top three funds for 2026 for your ISA or self-invested personal pension